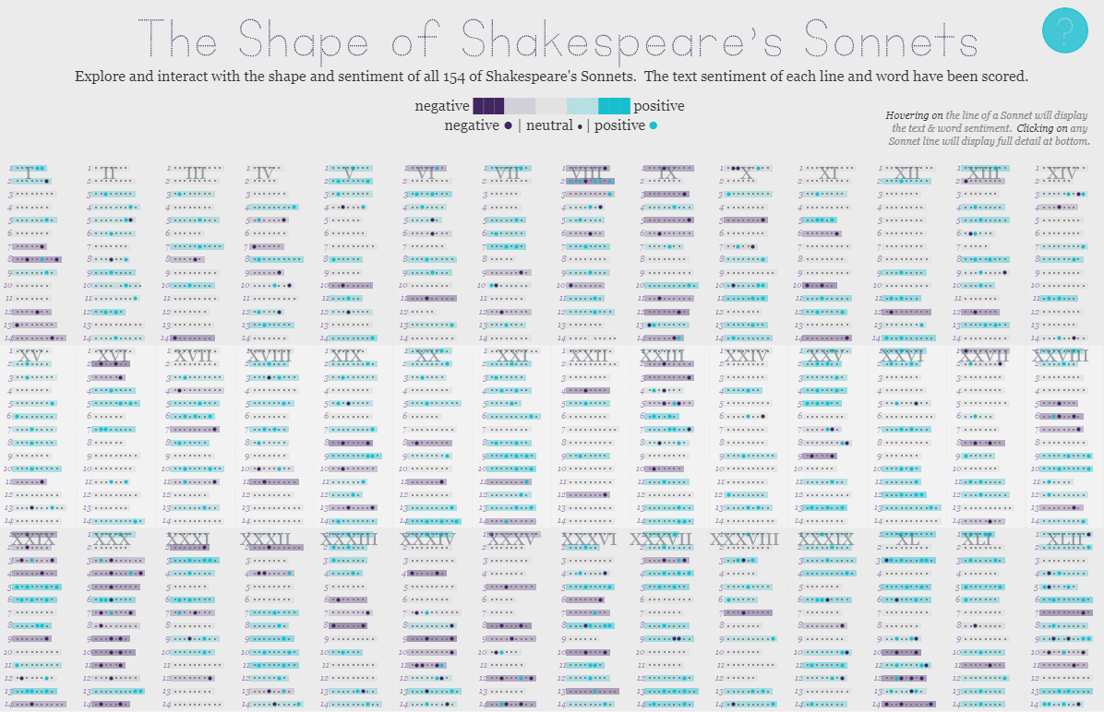
If it’s springtime that can only mean that it’s time to begin the feeder rounds for Tableau’s Iron Viz contest. The kick-off global theme for the first feeder is books & literature, a massive topic with lots of room for interpretation. So without further delay, I’m excited to share my submission: The Shape of Shakespeare’s Sonnets.
The genesis of the idea
The idea came after a rocky start and abandoned initial idea. My initial idea was to approach the topic with a meta-analysis or focus on the overall topic (‘books’) and to avoid focusing on a single book. I found a wonderful list of NYT non-fiction best sellers lists, but was uninspired after spending a significant amount of time consuming and prepping the data. So I switched mid-stream and decided to keep the parameters of a meta-analysis, but change to a body of literature that a meta-analysis could be performed on. I landed on Shakespeare’s Sonnets for several reasons:
- Rigid structure – great for identifying patterns
- 154 divides evenly for small multiples (11×14 grid)
- Concepts of rhyme and sentiment could easily be analyzed
- More passionate subject: themes of love, death, wanting, beauty, time
- Open source text, should be easy to find
- Focus on my strengths: data density, abstract design, minimalism
Getting Started
I wasn’t disappointed with my google search, it took me about 5 minutes to locate a fantastic CSV containing all of the Sonnets (and more) in a nice relational format. There were some criteria necessary for the data set to be usable – namely each line of the sonnet needed to be a record. After that point, I knew I could explode and reshape the data as necessary to get to a final analysis.
Prepping & Analyzing the Data
The strong structuring of the sonnets meant that counting things like number of characters and number of words would yield interesting results. And that was the first data preparation moment. Using Alteryx I expanded out line into columns for individual words. Those were then transposed back into rows and affixed to the original data set. Why? This would allow for quick character counting in Tableau, repeated dimensions (like line, sonnet number), and dimensions for the word number in each line.
I also extracted out all the unique words, counted their frequency, and exported them to a CSV for sentiment analysis. Sentiment analysis is a way to score words/phrases/text to determine the intention/sentiment/attitude of the words. For the sake of this analysis, I chose to go with a negative/positive scoring system. Using Python and the nltk package, each word’s score was processed (with VADER). VADER is optimized for social media, but I found the results fit well with the words within the sonnets.
The same process was completed for each sonnet line to get a more aggregated/overall sentiment score. Again, Alteryx was the key to extracting the data in the format I needed to quickly run it through a quick Python script.
Here’s the entire Alteryx workflow for the project:

The major components
- Start with original data set (poem_lines.csv)
- filter to Sonnets
- Text to column for line rows
- Isolate words, aggregate and export to new CSV (sonnetwords.csv)
- Isolate lines, export to new CSV (sonnetlines)
- Join swordscore to transformed data set
- Join slinescore to transformed data set
- Export as XLSX for Tableau consumption (sonnets2.xlsx)
Python snippet

The Python code is heavily inspired by a blog post from Brit Cava in December 2016. Blog posts like hers are critically important, they help enable others within the community do deeper analysis and build new skills.
Bringing it all together
Part of my vision was the provoke patterns, have a highly dense data display, and use an 11×14 grid. My first iteration actually started with mini bar charts for number of characters in each word. The visual this produced was what ultimately led to the path of including word sentiment.

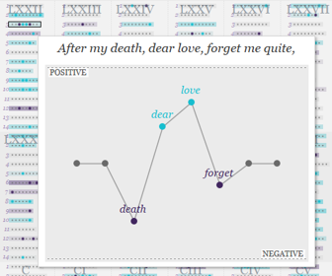
This eventually changed to circles, which led to the progression of adding a bar to represent the word count of each individual line. The size of the words at this point became somewhat of a disruption on the micro-scale, so sentiment was distilled down into 3 colors: negative, neutral, or positive. The sentiment of the entire line instead has a gradient spectrum (same color endpoints for negative/positive). Sentiment score for each word was reserved for a viz in tool tip – which provides inspiration for the name of the project.
Each component is easy to see and repeated in macro format at the bottom – it also gives the end user an easy way to read each Sonnet from start to finish.

And there you have it – a grand scale visualization showing the sentiment behind all 154 of Shakespeare’s Sonnets. Spend some time reciting poetry, exploring the patterns, and finding the meaning behind this famous body of literature.
Closing words: thank you to Luke Stanke for being a constant source of motivation, feedback, and friendship. And to Josh Jackson for helping me battle through the creative process.
The Shape of Shakespeare’s Sonnets

Leave a Reply