After the terrible flurry of complaints, Sarah and I continued on with week 8 of the dear data postcard project we’re conducting. Week 8 was a welcome change, tracking how often we use our phones.
I was excited to jump on this topic to know more insight into what I’m doing on my phone (although there is also screen time now). To track the data for the week, I created IFTTT buttons that identified the first reason that I picked up my phone. This allowed me to keep track of the time, category, and also add on a more detailed reason.
Because I chose to capture only the first thing I did on my phone, I feel that the data well represents that, but may miss out on additional tasks or items I was doing after I unlocked my phone. It may be better to say that these items were what caused my attention to be diverted to my phone OR were a necessary task to be done (mapping/music) via my phone.

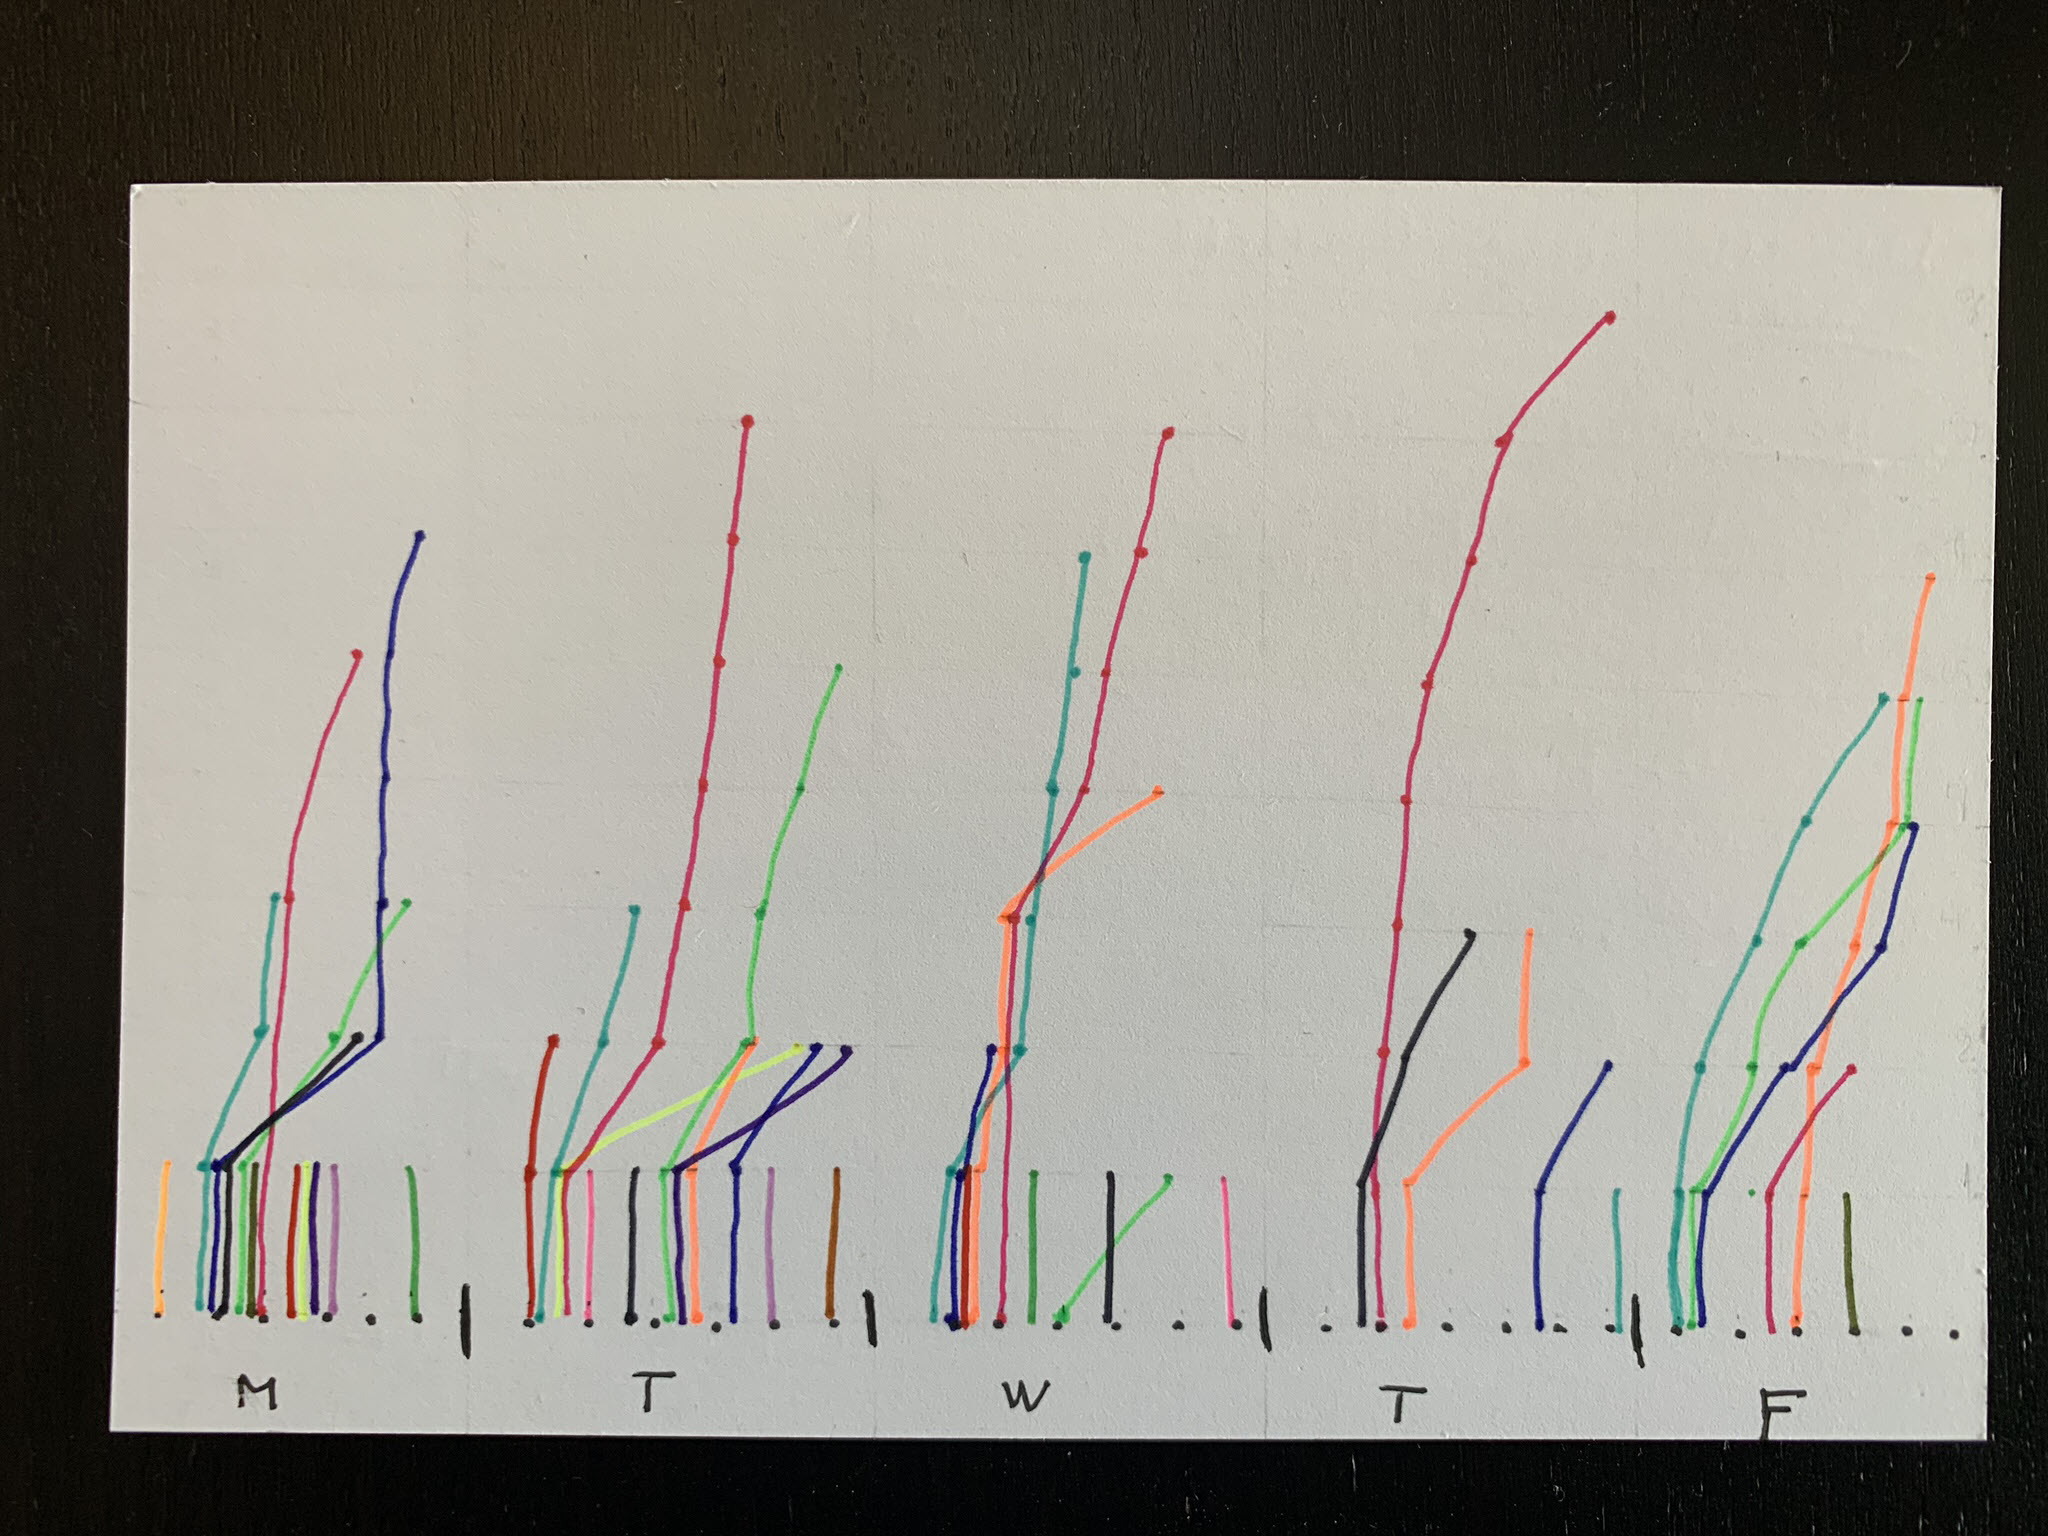
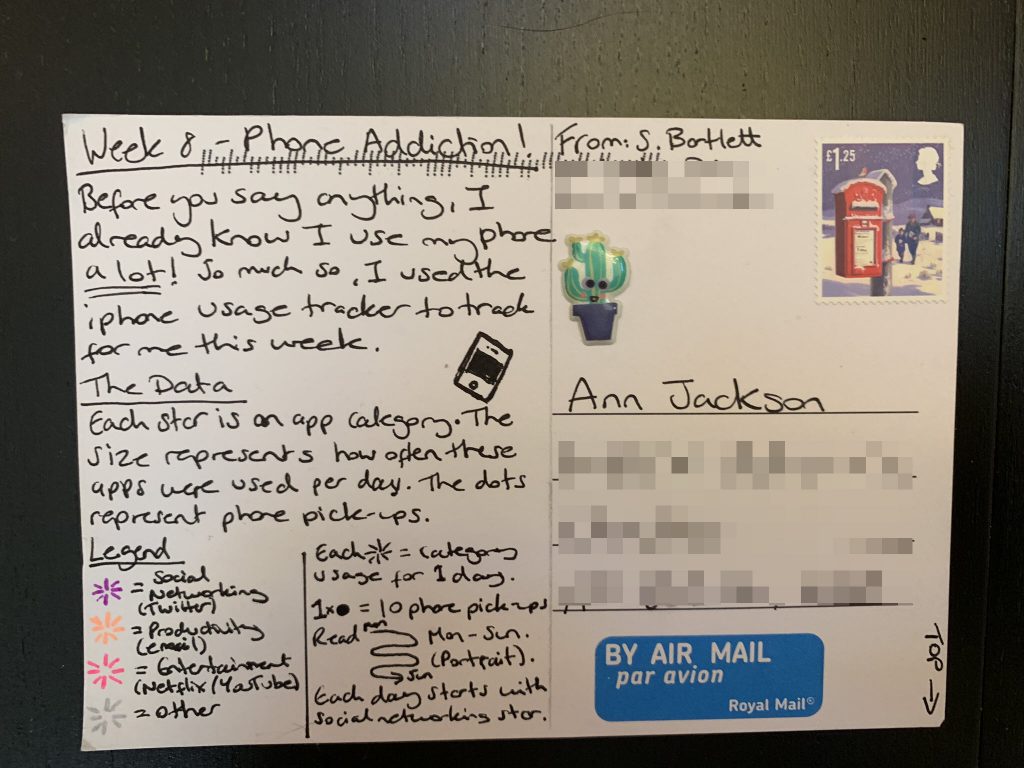
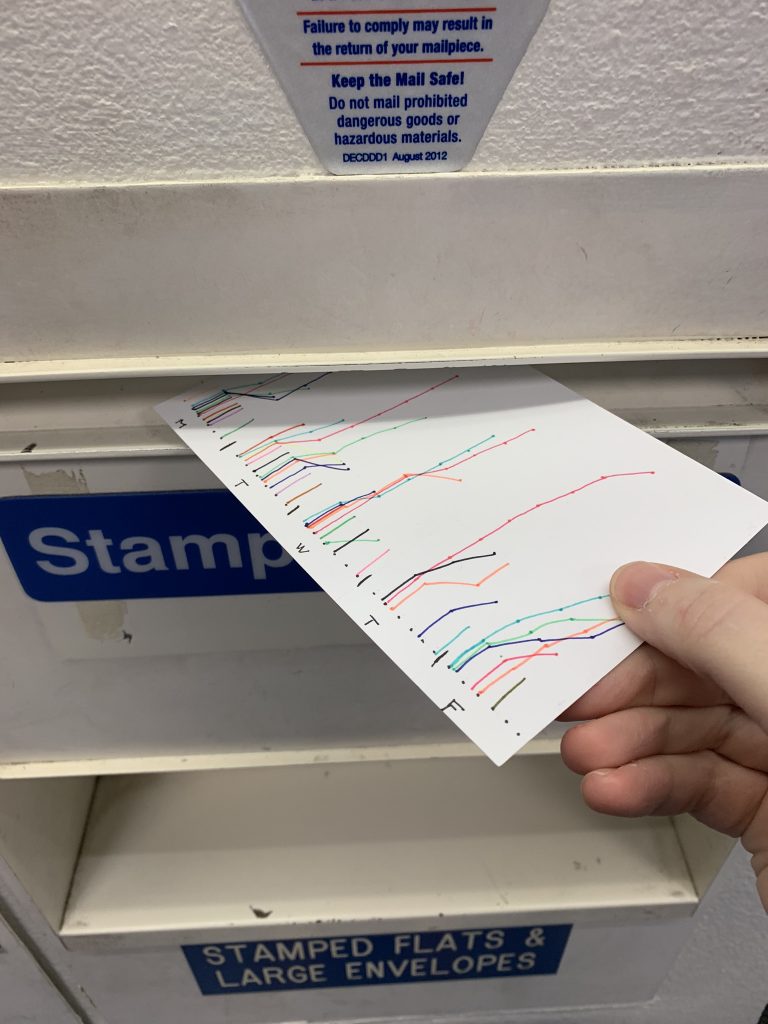
This postcard has the most detail from me to-date. After tracking the data, I was really only able to whittle it down to 15 different distinct categories. I felt that any further combining would ruin the detail of the data (and I didn’t like that I had to put flashlight and calculator together).
Each segment of the line represents one usage and the time. It is almost like a running total chart with the lines connected at the points in time for the day. It was the best way I could think to figure out how often I use my phone for something and when (ex: is it all day or only in the morning). You’ll notice that this is the second week where I’ve started to use a ruler and pencil to draw out my visualizations in advance – I’m getting much more precise with what I want to convey.
As no surprise and apparent by the back side, texting, email, and social media tend to make up the majority of my phone time. I was surprised by a lot of the smaller things that I don’t think about, but only do on my phone – in particular shopping, which includes both grocery shopping at the store and online shopping.
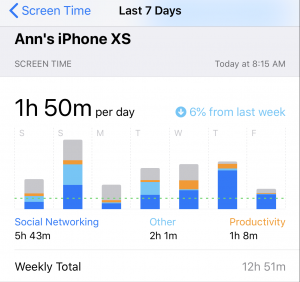
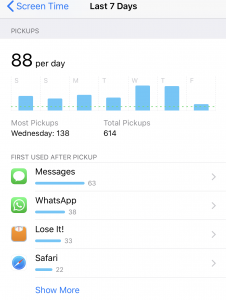
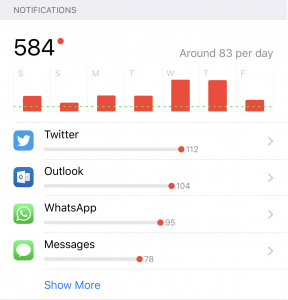
I forgot to check my screen time at the end of the week, so here’s the most recent 7 days (does not align with my postcard, but should be good for additional context).
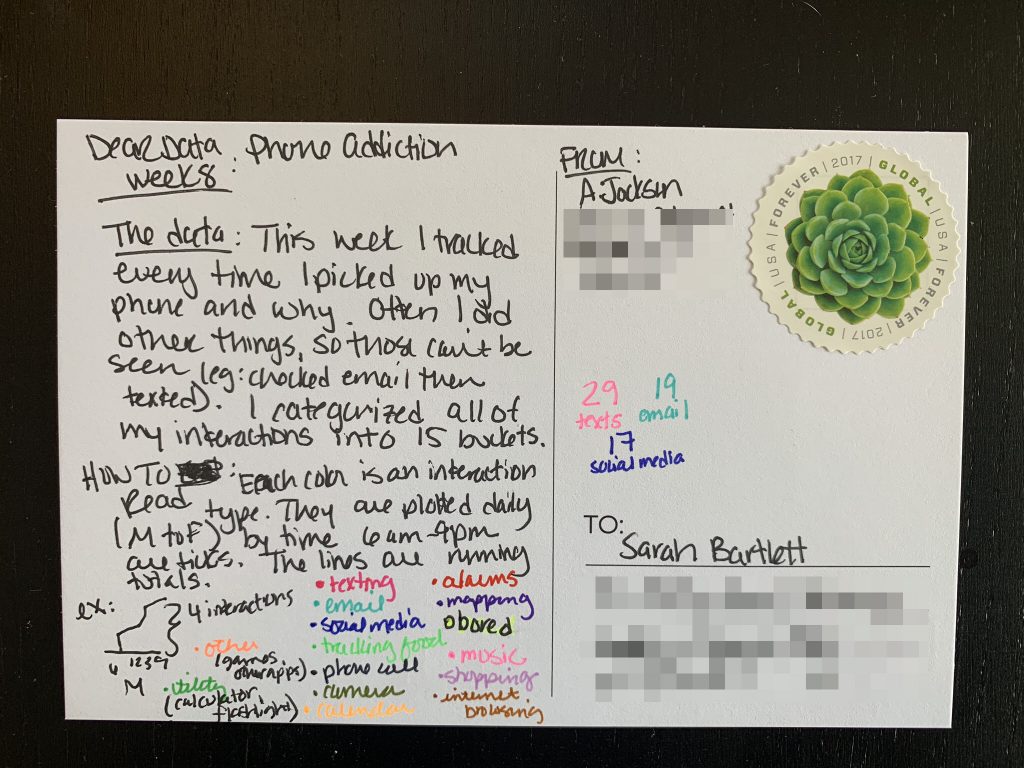
Here’s Sarah’s postcard for the week:
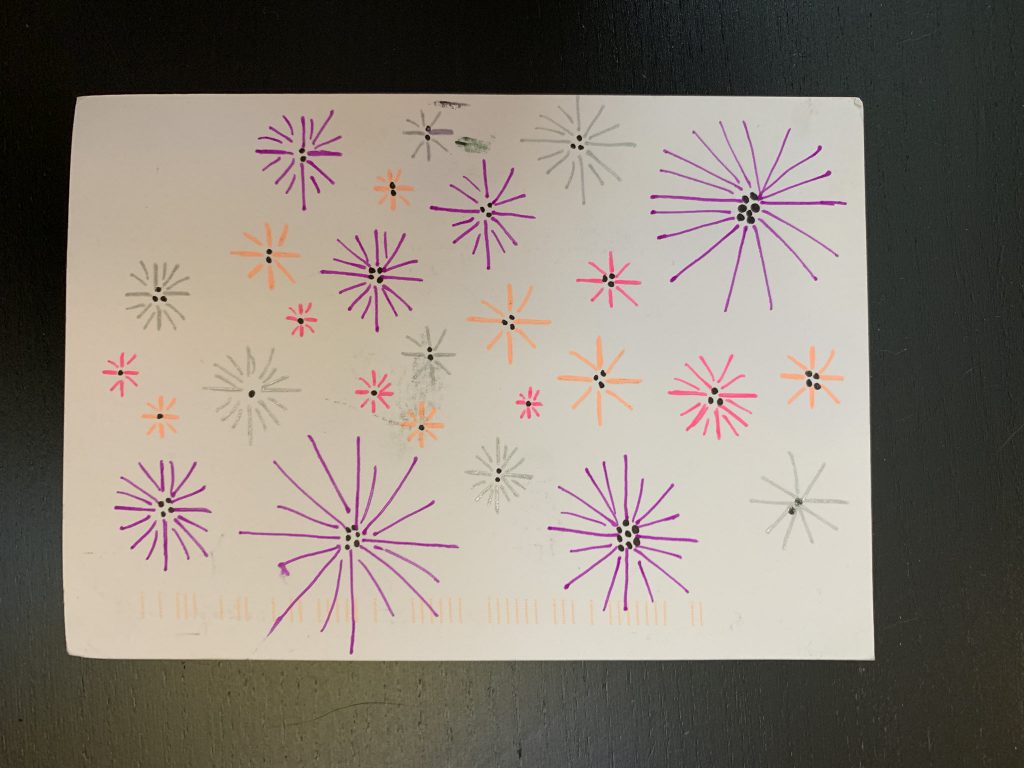
My first reaction when I saw this postcard was just amazement that Sarah was able to create such a beautiful picture with her data. The choice of colors, dots, and final shapes are so pretty. Then of course I’m immediately drawn to noticing that her social media habit picks up dramatically on the weekend (no surprise there), as does her usage of entertainment apps.
In short, Sarah managed to take a topic that we both probably don’t feel the best about and portray it in a beautiful way!
And that’s a wrap on this week. I really enjoyed this one, both from the two visualizations we made, to tracking and recognizing what I use my phone for. It’s not all evil (social media), there are lots of little things I depend on it for – including mapping, music, calculator, a time – the list goes on. So while it may be most known for communicating with others, it really does serve it’s purpose to help me in all facets of my life.
Don’t forget to check out Sarah’s take on the week!