Category: Alteryx
-
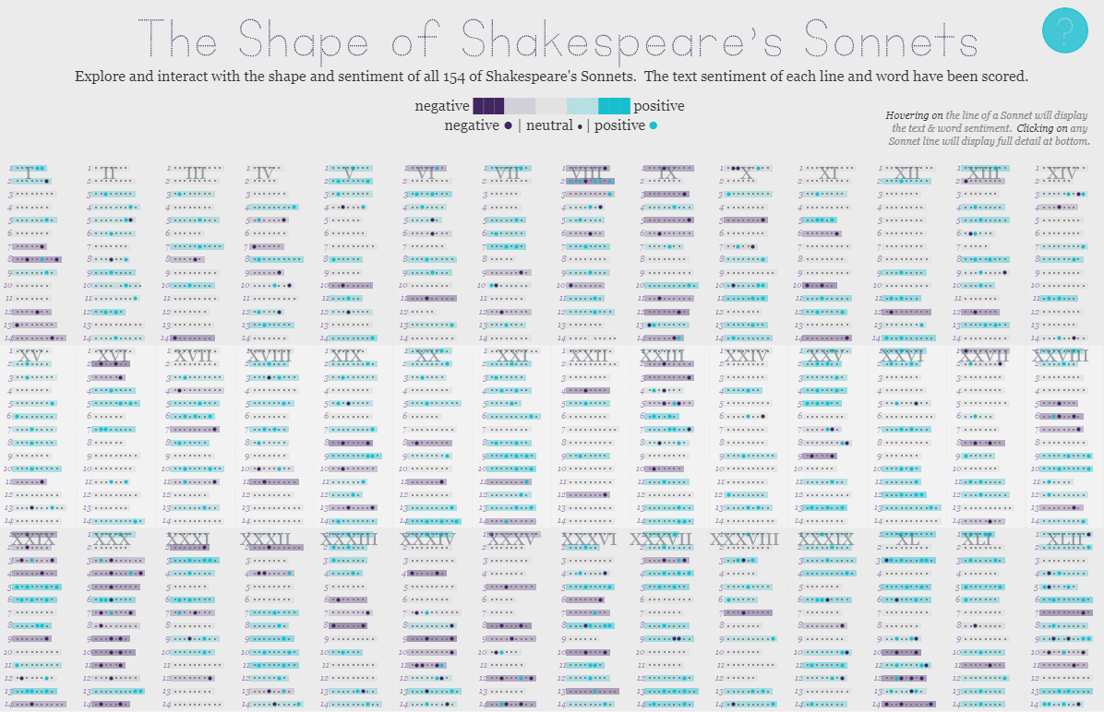
The Shape of Shakespeare’s Sonnets | #IronViz Books & Literature
Jump directly to the viz If it’s springtime that can only mean that it’s time to begin the feeder rounds for Tableau’s Iron Viz contest. The kick-off global theme for the first feeder is books & literature, a massive topic with lots of room for interpretation. So without further delay, I’m excited to share my…
-
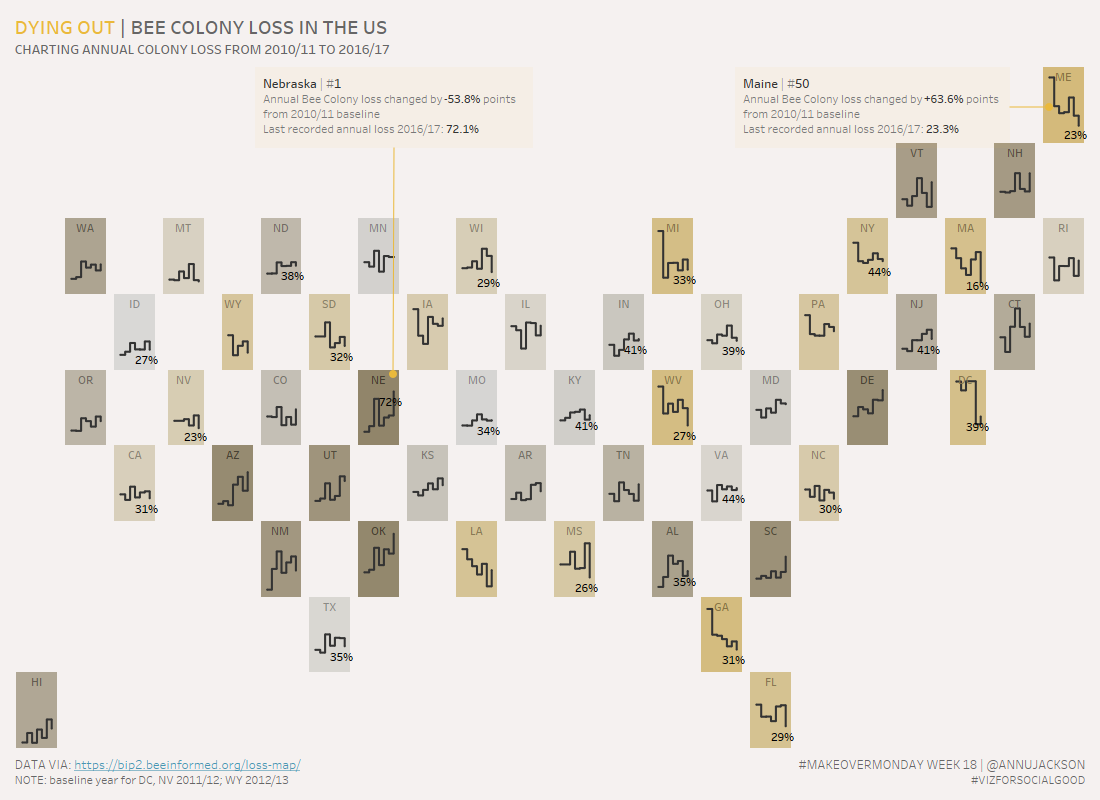
Dying Out, Bee Colony Loss in US | #MakeoverMonday Week 18
Week 18 of Makeover Monday tackles the issue of the declining bee population in the United States. Data was provided by BeeInformed and the re-visualization is in conjunction with Viz for Social Good. Unfamiliar with a few of the terms – check out their websites to learn what Makeover Monday and Viz for Social Good…
-
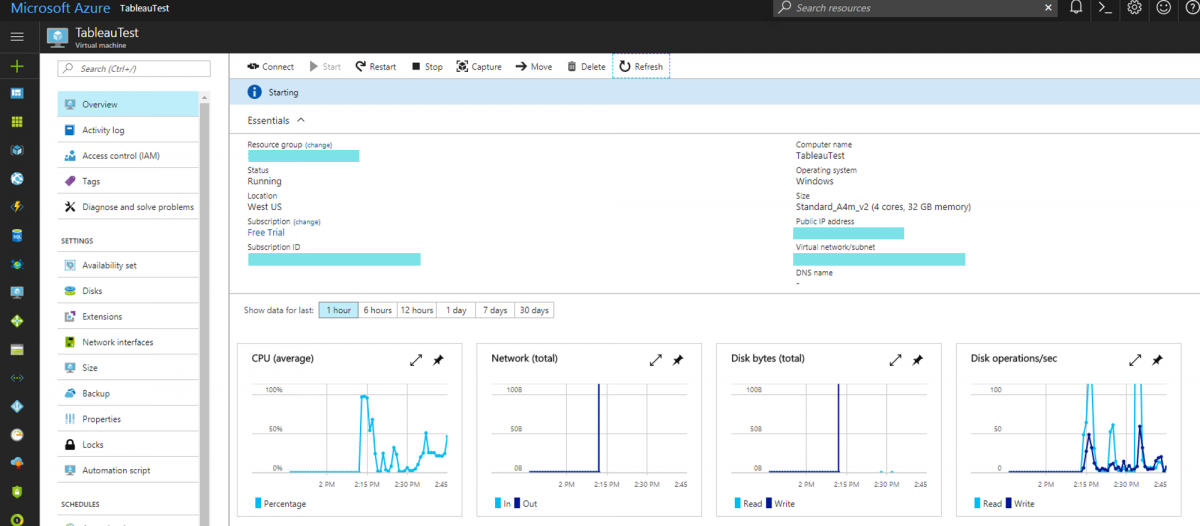
Azure + Tableau Server = Flex
I’m affectionately calling this post Azure + Tableau Server = Flex for two reasons. First – are you a desktop user that has always wanted to extend your skills in Tableau as a platform? Or perhaps you’re someone who is just inherently curious and gains confidence by learning and doing (I fall into this camp).…
-
Alteryx Inspire – Day 1
When I went to the Tableau Conference last year, I felt it was important to spend some time documenting my experience. Anytime I go to a conference related to my professional aspirations I’m always taken by the wealth of knowledge that’s uncovered. The Alteryx Inspire conference is a pared down conference with about 2,000 attendees.…