Week 9 of the data postcard project Sarah Bartlett and I are working on have arrived. The topic of the week was To Do Lists. I don’t actively keep good lists of tasks – they make me sad – especially when I have tasks that continue to go undone. I also think they miss describing/capturing how priorities can change. So instead of starting and attempting to track a to do list, I instead chose to track what it is I’m doing.
I’ll be more clear – because of my line of work I track all of my work using an app. It’s very detailed to include project specifics. I figured it would be interesting to see how my attention gets divided in a given week. From a data collection perspective this meant I didn’t have to do anything different – the data I have is already tracked and the behavior already exists.
So at the end of the week how did my schedule look?

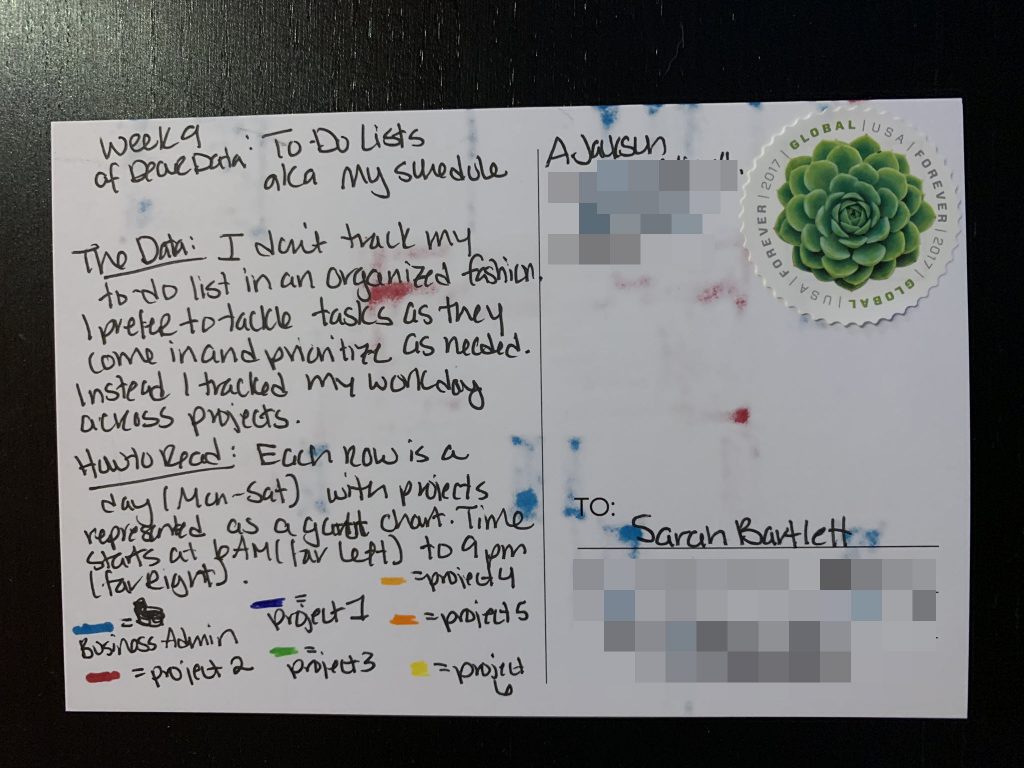
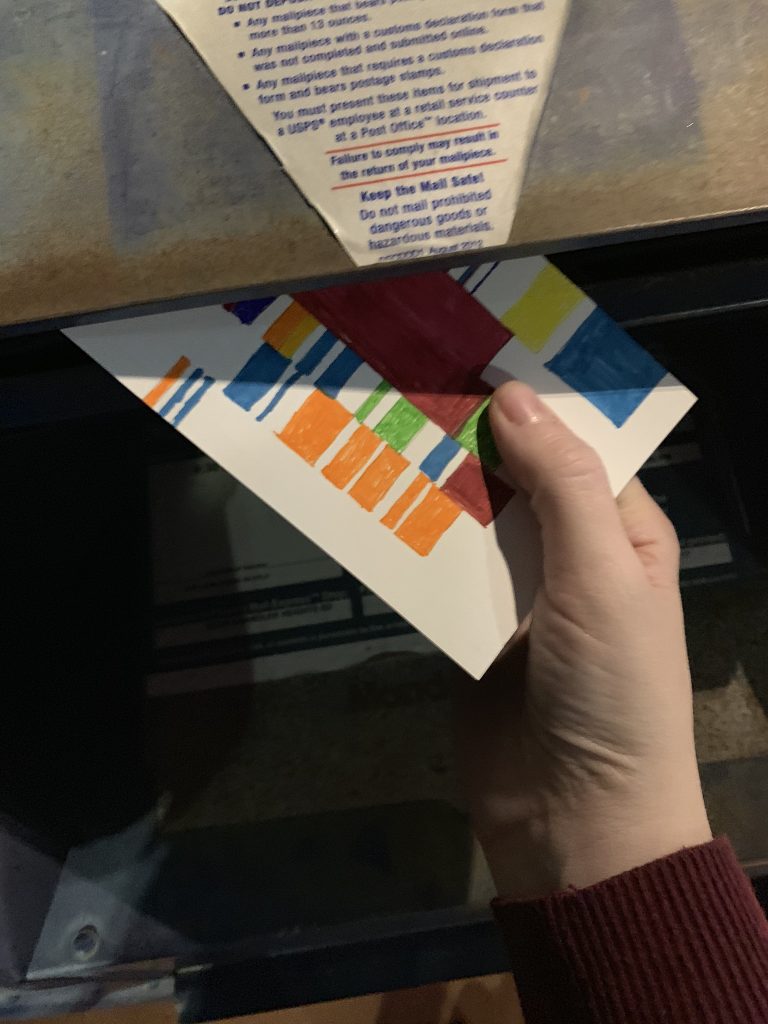
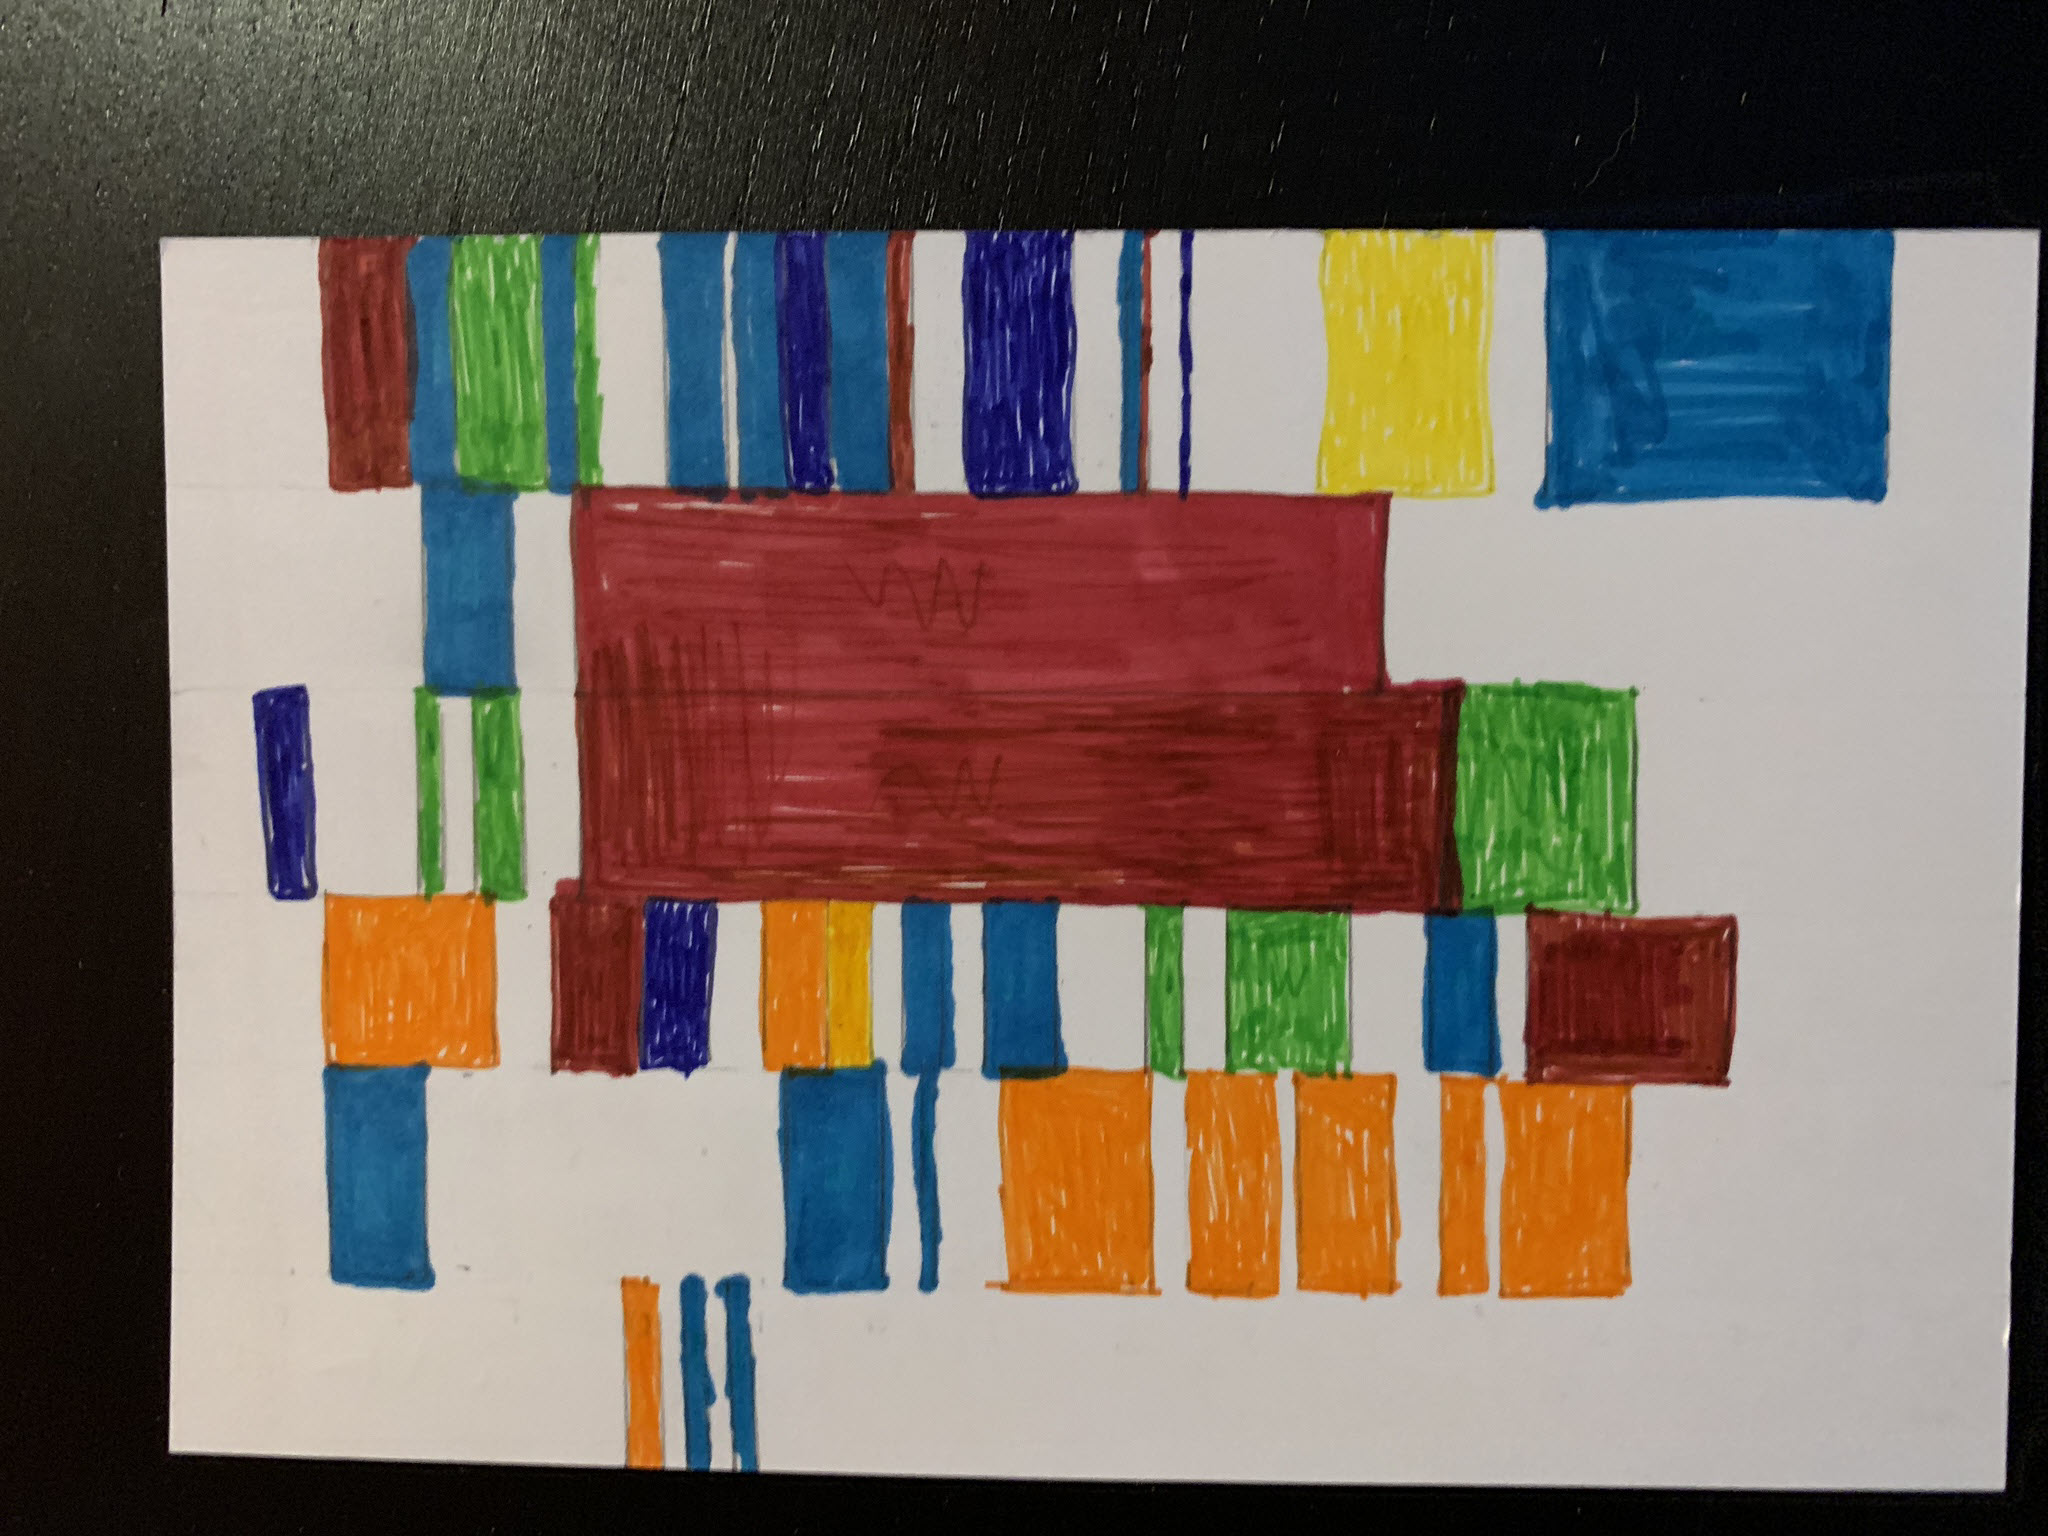
I ended up creating a classic Gantt chart showing Monday through Saturday. The bars are positioned based on time, with the far left being 6 AM and the far right being 9 PM, the width of the bars is duration (in time) and the color of the bars represents the projects I was working on.
I will say this was a particularly busy week for me, as you can tell, I like to have 2 major projects going (red & orange) at a time with a significant amount of time spent on keeping the business running (the lighter blue). There’s some obvious bleed through of other projects this week, so it’s interesting to see how and when they get integrated.
All the white space is non-clocked time. Depending on where I am, I usually find myself getting up for 5 to 10 minutes and taking a break to reset or switching to a different task. I enjoyed seeing this week illustrated, because it is a good reminder that a structured 9 to 5 schedule isn’t very realistic. It’s much more fluid, with similar start and stop times for each day, but with small gaps driven by the tasks being worked on.
Sarah on the other hand chose to lean in on creating to do lists, here is here postcard:
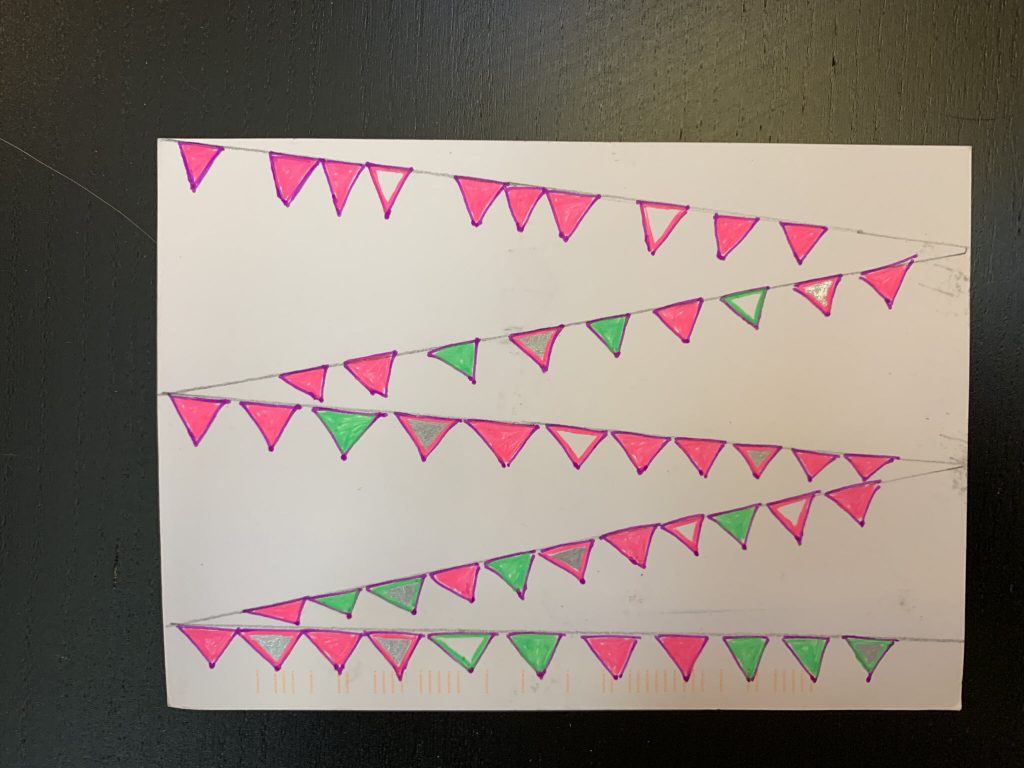
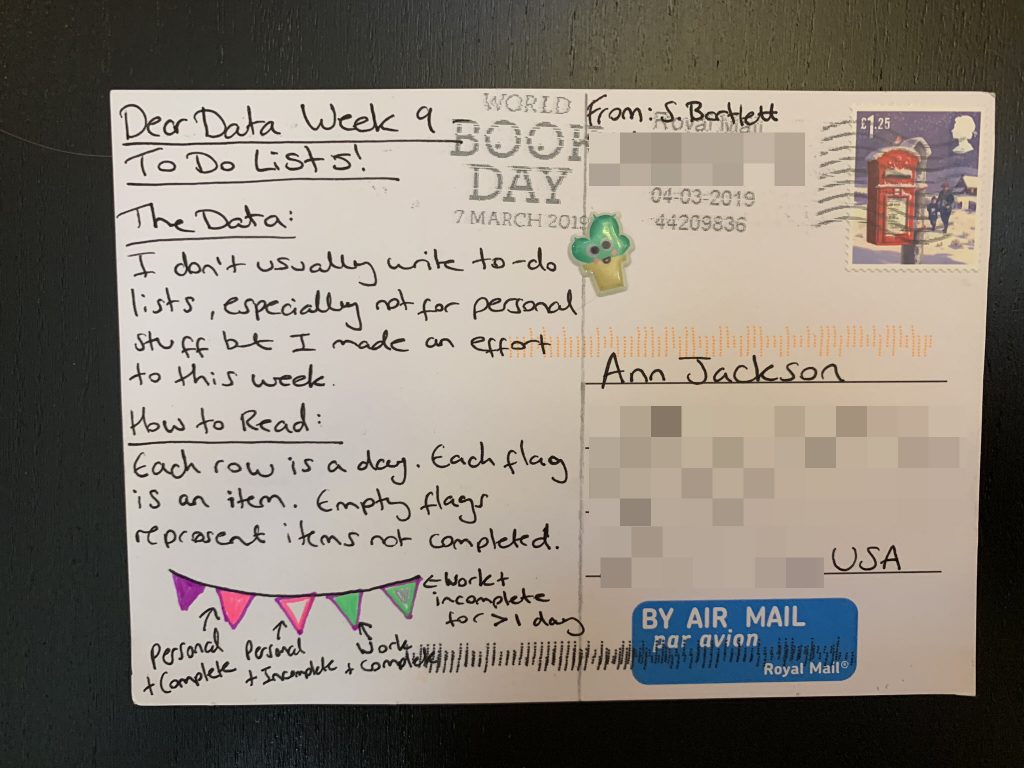
She admits, as I have, that to-do lists aren’t really her thing (which I rejoiced!). Immediately what’s interesting about her list is that it is dominated by personal tasks. For what I am assuming is a normal work week only about 25% of her to-dos fall in the work bucket. And I’d even say that she gets a large majority of her tasks done within the day of when she sets them up. I also like the nuance of metallic silver she’s added for aging tasks – a bit hard to see in the photo, but they add tremendous design effect in person.
I’m noticing an emerging trend as we continue to create the postcards. Sarah has gone further down using other objects as abstract representations (she herself called the triangles flags) whereas I am mostly still in a more direct mode of creating charts).
In real time we’re on week 13 – so there’s more to come and more mail to catch up with the progress we’ve made.
As always, don’t forget to check out Sarah’s blog on the topic.