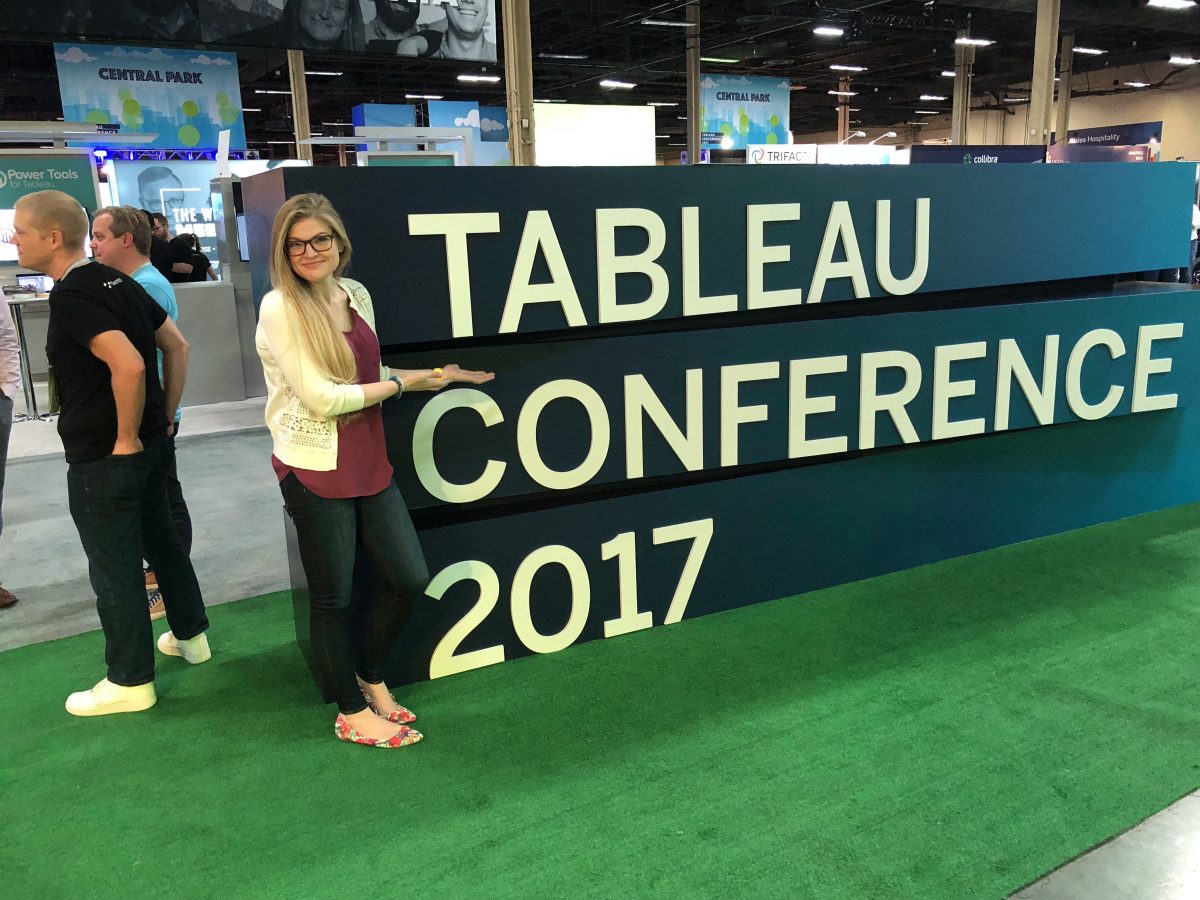
Now that Tableau Conference 2017 has come to a close it’s time to reflect back on my favorite and most memorable moments. I’ll preface by saying that I had very lofty goals for this conference. It started after #data16 – immediately after the conference I did some significant thought work on what I wanted my year to look like and HOW I wanted to shape it. It began by deeply examining my why. My why is a personal mission that transcends my professional career. I firmly believe that visualizing data is the BEST way to get closer to the truth and to grow, learn, and improve. I also strongly feel that every individual should use analytics in making decisions.
Without further ado – here’s my top 5.
#1 – Participating in #MakeoverMonday live

This is my number one because it represents the culmination of a lot of my personal growth and effort this year. Coming out of #data16 I committed myself to doing every #MakeoverMonday and most specifically participating in this event. I’ll admit I have a few weeks still outstanding, but I’m on track to have a full portfolio by the end of 2017. This was also the moment I was most anxious about. Would I be able to develop something in an hour AND feel comfortable enough to share it with a large audience? Well at the end of the hour I accomplished everything I had been anticipating and more. With the support of the amazing #MakeoverMonday family and those around me I got up and presented my viz. And to boot it became a Viz of the Day (VOTD) the following day. Talk about a crowning achievement. Taking something that I had a bit of nerves about and turning it into a super proud moment.
#2 – Community Battle: 60 Second Viz Tips

I think the picture says it all. A rapid fire tips battle at 9 am the day after Data Night Out? YES please. This session was an unbelievable joy to participate in. Birthed out of the minds of the amazing London Tableau User Group and brought to the sessions of conference. As if by fate the first community folks that found me when I dropped in on Vegas were none other than Paul Chapman and Lorna Eden. I can’t be more grateful for the opportunity to contribute to the conference. And let’s not forget the trophy guys. This is a new tradition I’d love to see carry out into the conferences to come.
#3 – The Vizzies!

A pure demonstration of the awesome Tableau community that exists globally. I was so honored to be recognized this year as a Community Leader. Just take a look at the amazing folks that I am so thankful to be surrounded by. More than being recognized, the fact that the community was so prominent is unbelievable. I couldn’t go anywhere without being stopped and having conversations, hugs, or smiles shared between community members.
#4 – Iron Viz!

As I always say – the pinnacle when it comes to Tableau. The chance to see what 20 minutes of extreme vizzing looks like from the front row. This one is near and dear to my heart because I submitted for each of the feeder contests this year. I’d love the opportunity to get up on the big stage and participate, but barring that – it’s an enthusiast’s dream to see the excitement play out on the big stage.
#5 – Fanalytics

Although it is coming in at my #5, this is probably the highest impact moment of conference. A 3+ hour conversation started by important members of the Tableau community talking about their journey and growth. It ended with me facilitating one of 8 conversations about important topics the community is facing. Mine was focused on female participation in #IronViz. What was interesting about this was the massive feeling that we needed more data to wrap our arms around the topic. And this has become my first action item post-conference. I wanted to extend the conversation beyond the round table of remaining conference goers and into the broader community.
Updated to include @shortenl – so sorry to have missed you and your amazing contributions before! pic.twitter.com/azVAHu17xU
— Ann Jackson (@AnnUJackson) October 14, 2017
I’ve been so inspired, impressed, and energized by all the community and people I encountered over the past week. I can’t wait to see what the next 12 months look like.
And now that I’ve provided my top 5, I’m curious – what are your top #data17 moments?

Leave a Reply