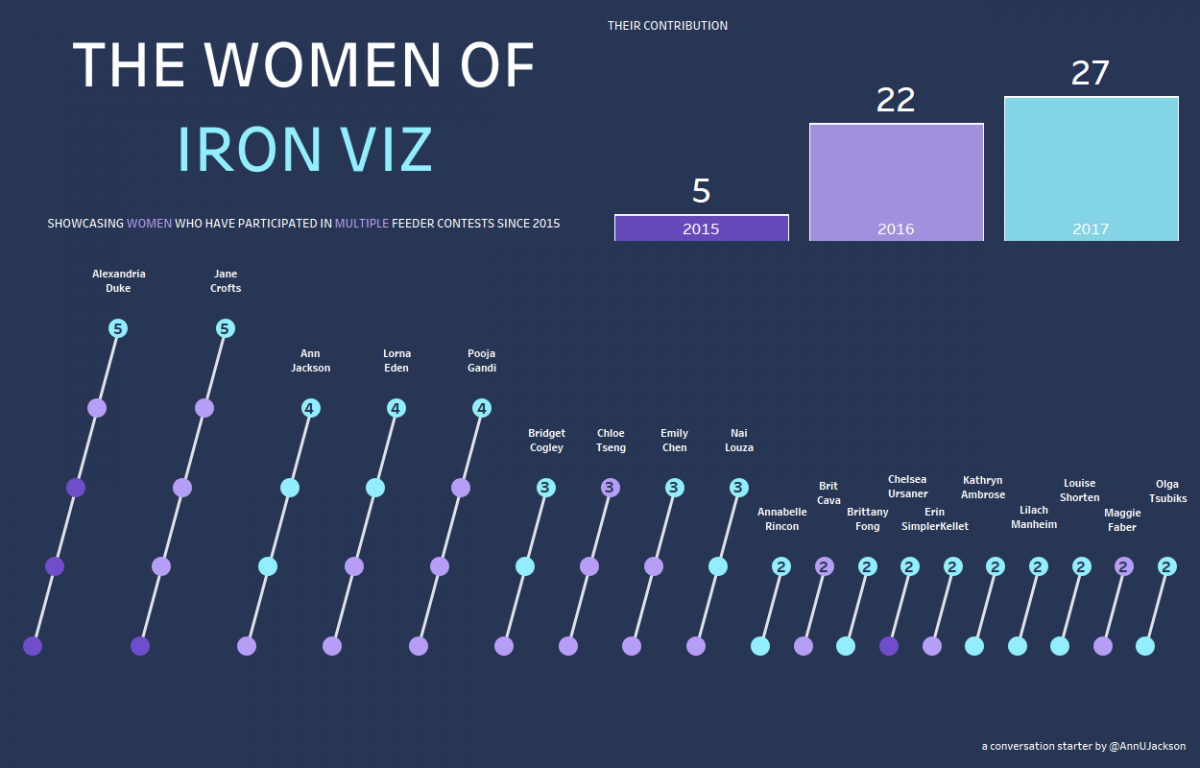
It’s now 5 days removed from the Tableau Conference (#data17) and the topic of women in data visualization and the particularly pointed topic of women competing in Tableau’s #IronViz competition is still fresh on everyone’s mind.
First – I think it’s important to recognize how awesome the community reception of this topic has been. Putting together a visualization that highlights a certain subsection of our community is not without risk. While going through the build process, I wanted to keep the visualization in the vein of highlighting the contributions of women in the community. It wasn’t meant to be selective or exclusive, instead, a visual display of something I was interested in understanding more about. Despite being 5 days removed from the conference, the conversations I’ve been involved in (and observed from a distance) have all remained inclusive and positive. I’ve seen plenty of people searching for understanding and hunting for more data points. I’ve also seen a lot of collaboration around solutions and collecting the data we all seek. What I’m thankful that I have not witnessed is blame or avoidance. In my mind this speaks volumes to the brilliant and refined members of our community and their general openness and acceptance of change, feedback, and improvement.
One thing circling the rounds that I felt compelled to iterate off of, is @visualibrarian’s recent blog post that has interview style questions and answers around the topic. I am a big believer in self reflection and exploration and was drawn to her call to action (maybe it was the punny and sarcastic nature of the ask) to answer the questions she put forth.
1. Tell me about yourself. What is your professional background? When did you participate in Iron Viz?
My professional background is that of a data analyst. Although I have a bachelor’s degree in Mathematics, my first professional role was as a Pharmacy Technician entering prescriptions. That quickly morphed into someone dedicated to reducing prescription entry errors and built on itself over and over to be put in roles like quality improvement and process engineering. I’ve always been very reliant on data and data communication (in my early days as PowerPoint) to help change people and processes. About 2 or 3 years ago I got fed up with being the business user at the mercy of traditional data management or data owners and decided to brute force my way into the “IT” side of things. I was drawn to doing more with data and having better access to it. Fast-forward to the role I’ve had for a little over 8 months as a Data Visualization Consultant. Which essentially means I spend a significant amount of my time partnering with organizations to either enable them to use visual analytics, improve the platforms that they are currently using, or overcoming any developmental obstacles they may have. It also means I spend a significant amount of time championing the power of data visualization and sharing “best practices” on the topic. I often call myself a “data champion” because I seek simply to be the voice of the data sets I’m working with. I’m there to help people understand what they’re seeing.
In terms of Iron Viz – I first participated in 2016’s 3rd round feeder, Mobile Iron Viz. I’ve since participated in every feeder round since. And that’s the general plan on my end, continue to participate until I make it on stage or they tell me to stop 🙂
2. Is Tableau a part of your job/professional identity?
Yes – see answer to question #1. It’s pretty much my main jam right now. But I want to be very clear on this point – I consider my trade visual analytics, data visualization, and data analytics. Tableau is to me the BEST tool to use within my trade. By no means the only tool I use, but the most important one for my role.
3. How did you find out about Iron Viz?
When I first started getting more deeply involved in my local User Group, I found out about the competition. Over time I became the leader of my user group and a natural advocate for the competition. Once I became a part of the social community (via Twitter) it was easy to keep up with the ins and outs of the competition.
4. Did you have any reservations about participating in Iron Viz?
Absolutely – I still have reservations. The first one I participated in was sort of on the off chance because I found something that I want to re-visualize in a very pared down elegant, simplistic way. I ended up putting together the visualization in a very short period of time and after comparing it to the other entries I felt my entry was very out of place. I tend to shy away from putting text heavy explanations within my visualizations, so I’ve felt very self-conscience that my designs don’t score well on “story telling.” It was also very hard in 2016 and the beginning of 2017. Votes were based off of Twitter. You could literally search for your hashtag and see how many people liked your viz. It’s a very humbling and crushing experience when you don’t see any tweets in your favor.
5. Talk me through your favorite submission to Iron Viz. What did you like about it? Why?
Ah – they are all my favorite for different reasons. For each entry I’ve always remained committed and deeply involved in what the data represents. Independent of social response, I have always been very proud of everything I’ve developed. For no other reason than the challenge of understanding a data set further and for bringing a new way to visually display it. My mobile entry was devastatingly simple – I love it to death because it is so pared down (the mobile version). For geospatial I made custom shapes for each of the different diamond grades. It’s something I don’t think anyone in the world knows I did – and for me it really brought home the lack of interest I have in diamonds as rare coveted items.
6. What else do you remember about participating in Iron Viz?
The general anxiety around it. For geospatial 2017 I procrastinated around the topic so much. My parents actually came to visit me and I took time away from being with them to complete. I remember my mom consoling me because I was so adamant that I needed to participate.
Safari and Silver Screen were different experiences for me. I immediately locked in on data sets on subjects I loved, so there was less stress. When I did the Star Trek entry I focused on look and feel of the design and was so stoked that the data set even existed. Right now I am watching The Next Generation nightly and I go back to that visualization to see how it compares to my actual perception of each episode (in terms of speaking pace and flow).
7. Which Iron Viz competitions did you participate in, and why?
Everything since 2016 feeder round 3. I felt a personal obligation and an obligation to my community to participate. It was also a great way for me to practice a lot of what I tell others – face your fears and greet them as an awesome challenge. Remain enthusiastic and excited about the unknown. It’s not always easy to practice, but it makes the results so worth it.
8. What competitions did you not participate in, and why?
Anything before mobile – and only because I (most likely) didn’t know about it. Or maybe more appropriately stated – I wasn’t connected enough to the community to know of it’s existence or how to participate.
9. Do you participate in any other (non Iron Viz) Tableau community events?
Yes – I participate in #MakeoverMonday and #WorkoutWednesday. My goal for the end of 2017 is to have all 52 for each completed. Admittedly I am a bit off track right now, but I plan on closing that gap soon. I also participate in #VizForSocialGood and have participated in past User Group viz contests. I like to collect things and am a completionist – so these are initiatives that I’ve easily gotten hooked on. I’ve also reaped so many benefits from participation. Not just the growth that’s occurred, but the opportunity to connect with like-minded individuals across the globe. It’s given me the opportunity to have peers that can challenge me and to be surrounded by folks that I aspire to be more like. It keeps me excited about getting better and knowing more about our field. It’s a much richer and deeper environment than I have ever found working within a single organization.
10. Do you have any suggestions for improving representation in Iron Viz?
- Make it more representative of the actual stage contest
- Single data set
- Everyone submits on the same day
- People don’t tweet or reveal submissions until contest closes
- Judges provide scoring results to individual participants
- The opportunity to present analysis/results, the “why”
- Blind submissions – don’t reveal participants until results are posted
- Incentives for participation! It would be nice to have swag or badges or a gallery of all the submissions afterward
And in case you just came here to see the visualization that’s set as the featured image, here’s the link.
Leave a Reply