Category: opinion
-
Aiming for data-driven? Don’t forget the people.
I’ve been in this situation too much recently: I’m having a conversation with someone about the state of analytics and there’s a sudden turn to product feature comparison. What follows are a series of strengths and weaknesses bulletpoints. The kicker? Often the points are focused on what the tool can do, or how the tool…
-
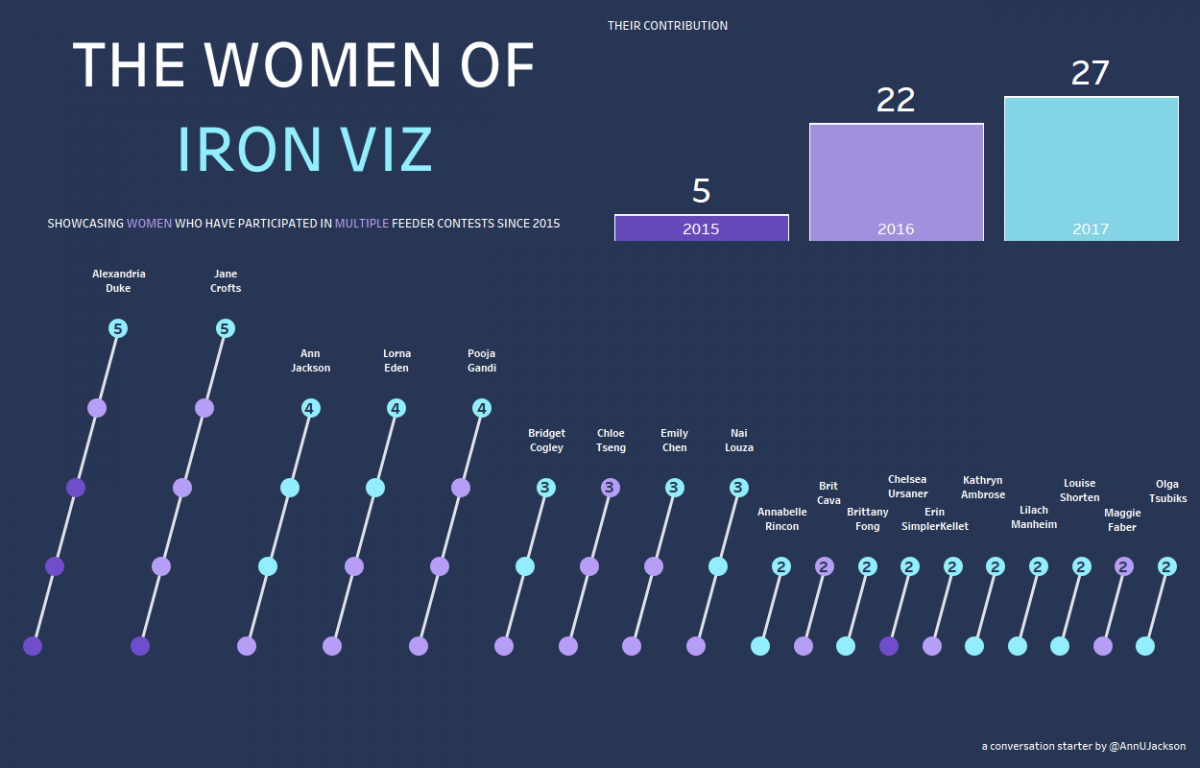
A follow up to The Women of #IronViz
It’s now 5 days removed from the Tableau Conference (#data17) and the topic of women in data visualization and the particularly pointed topic of women competing in Tableau’s #IronViz competition is still fresh on everyone’s mind. First – I think it’s important to recognize how awesome the community reception of this topic has been. Putting…
-
Don’t be a Bridge, Instead be a Lock
Lately I’ve spent a lot of time pondering my role in the world of data. There’s this common phrase that we as data visualization and data analytics (BI) professionals hear all the time (and that I am guilty of saying): “I serve as the bridge between business and IT.” Well – I’m here to say…
-
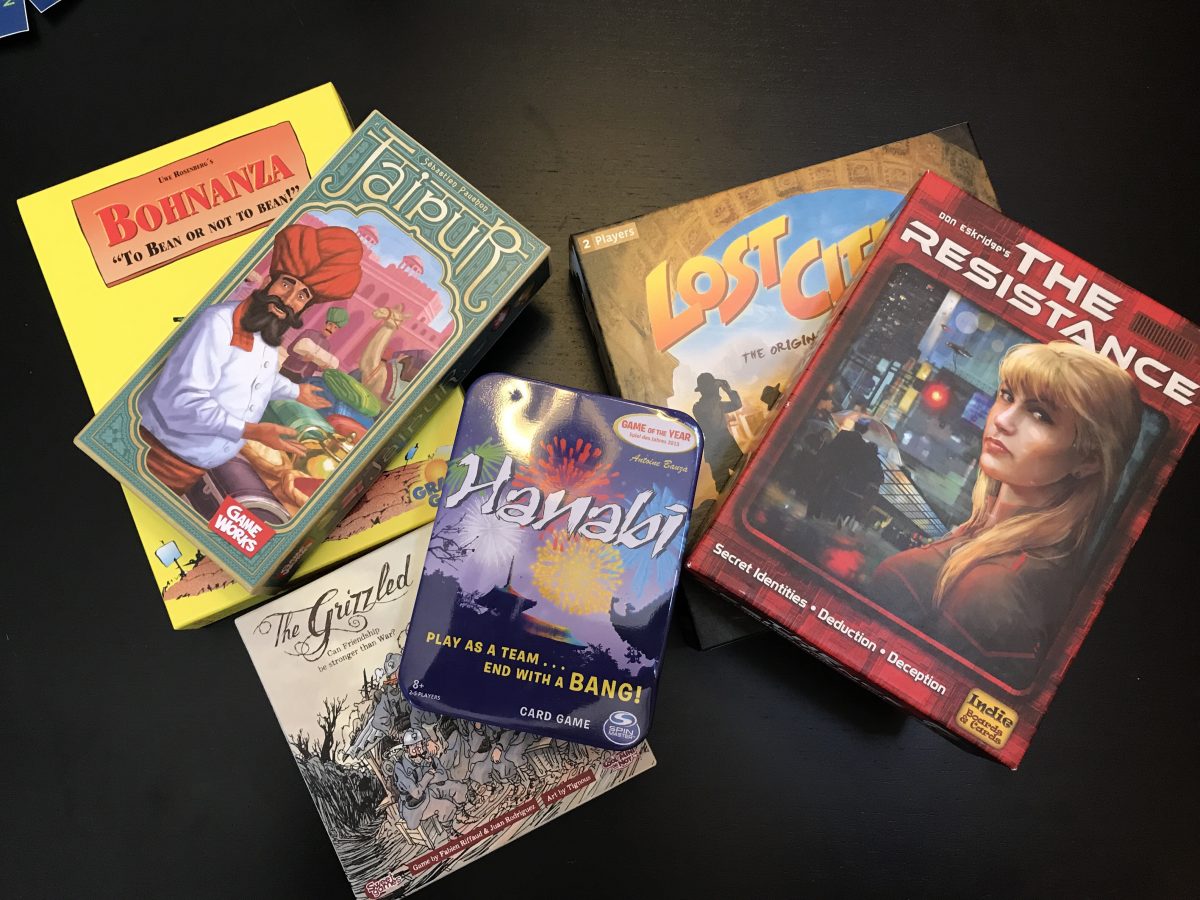
Boost Your Professional Skills via Games
Have you ever found yourself in a situation where you were looking for opportunities to get more strategic, focus on communication skills, improve your ability to collaborate, or just stretch your capacity to think critically? Well I have the answer for you: pick up gaming. Let’s pause for a second and provide some background: I…
-
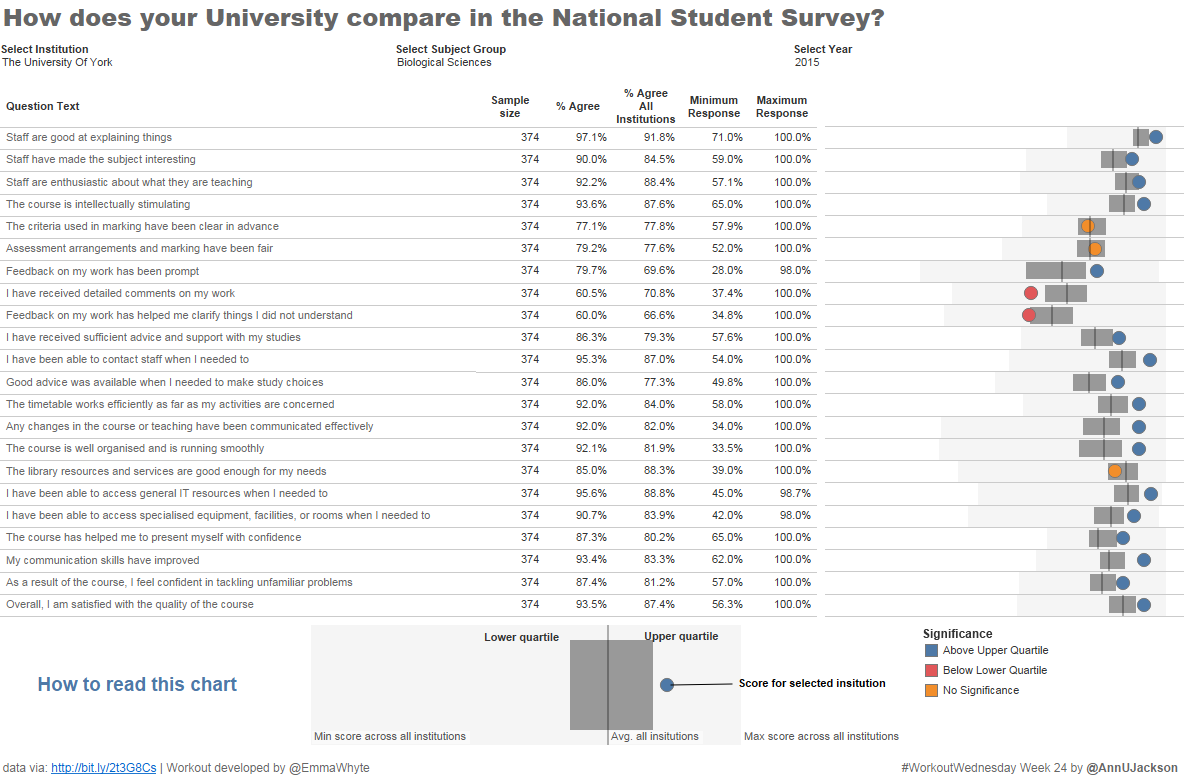
#WorkoutWednesday Week 24 – Math Musings
The Workout Wednesday for week 24 is a great way to represent where a result for a particular value falls with respect to a broader collection. I’ve used a spine chart recently on a project where most data was centered around certain points and I wanted to show the range. Propagating maximums, minimums, averages, quartiles,…
-
March & April Combined Book Binge
Time for another recount of the content I’ve been consuming. I missed my March post, so I figured it would be fine to do a combined effort. First up: The Icarus Deception by Seth Godin In my last post I mentioned that I got a recommendation to tune in to Seth and got the opportunity…
-
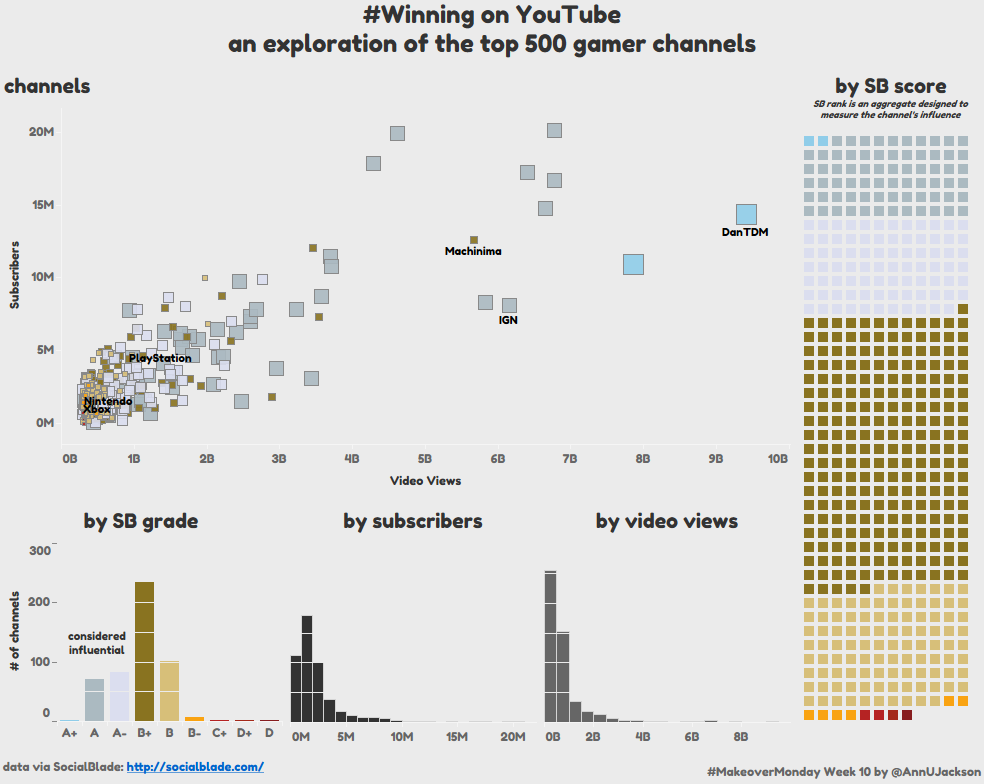
Makeover Monday Week 10 – Top 500 YouTube Game(r) Channels
We’re officially 10 weeks into Makeover Monday, which is a phenomenal achievement. This means that I’ve actively participated in recreating 10 different visualizations with data varying from tourism, to Trump, to this week’s Youtube gamers. First some commentary people may not like to read: the data set was not that great. There’s one huge reason why…
-

The Flow of Human Migration
Today I decided to take a bit of a detour while working on a potential project for #VizForSocialGood. I was focused on a data set provided by UNICEF that showed the number of migrants from different areas/regions/countries to destination regions/countries. I’m pretty sure it is the direct companion to a chord diagram that UNICEF published…
-
How do you add value through data analytics?
I recently read this article that really ignited a lot of thoughts that often swirl around in my mind. If you were to ask me what my drive is, it’s making data-informed, data-driven decisions. My mechanism for this is through data visualization. More broadly than that, it is communicating complex ideas in a visual manner.…