Category: Data Visualization
-
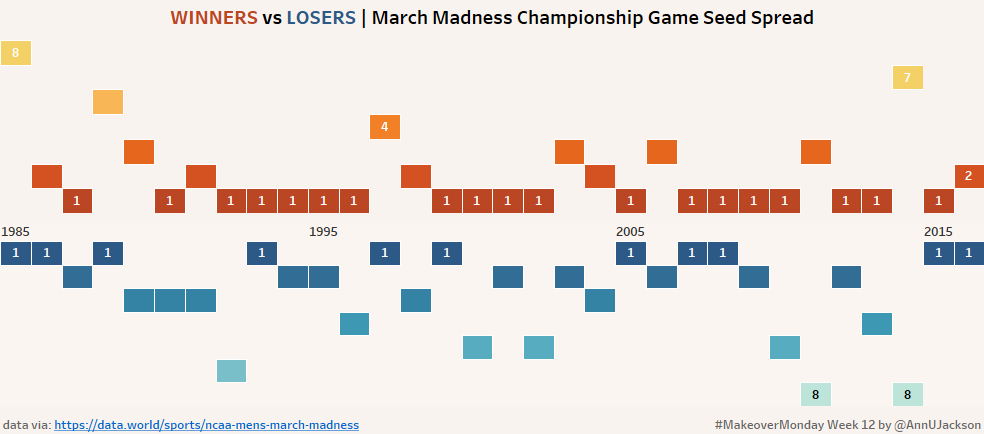
#MakeoverMonday Week 12 – All About March Madness
This week’s Makeover Monday topic was based on an article attempting to provide analysis into why it is harder for people to correctly pick their March Madness brackets. The original visualization is this guy: With most Makeover Monday approaches I like to review the inspiration and visualization and let that somewhat decide the direction of…
-
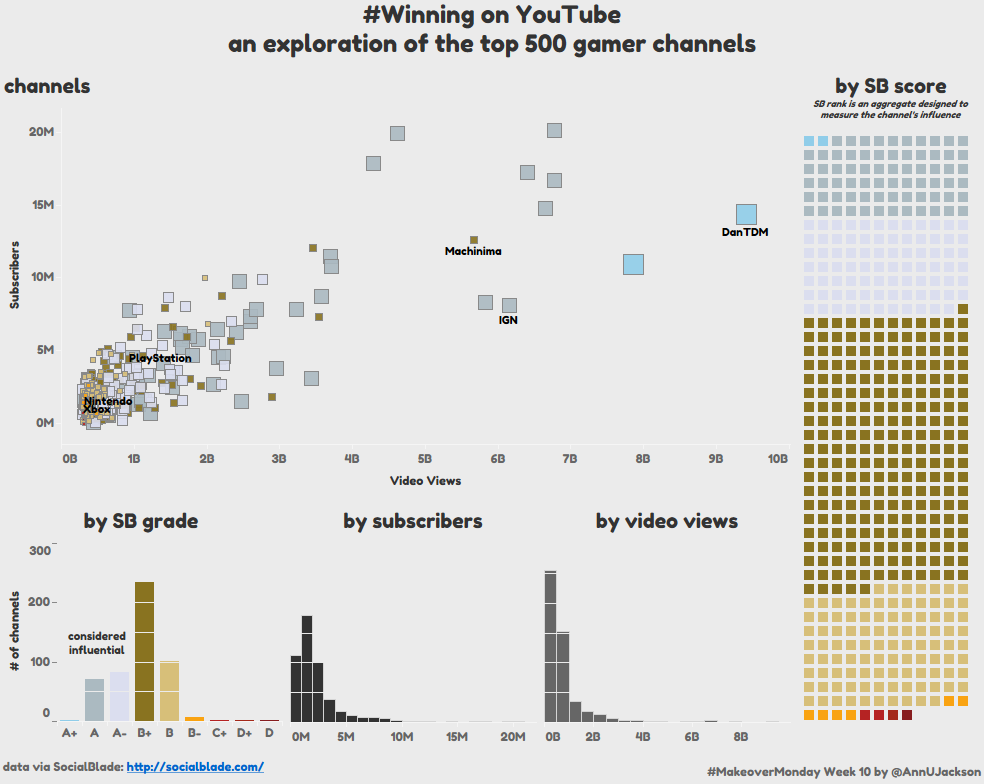
Makeover Monday Week 10 – Top 500 YouTube Game(r) Channels
We’re officially 10 weeks into Makeover Monday, which is a phenomenal achievement. This means that I’ve actively participated in recreating 10 different visualizations with data varying from tourism, to Trump, to this week’s Youtube gamers. First some commentary people may not like to read: the data set was not that great. There’s one huge reason why…
-
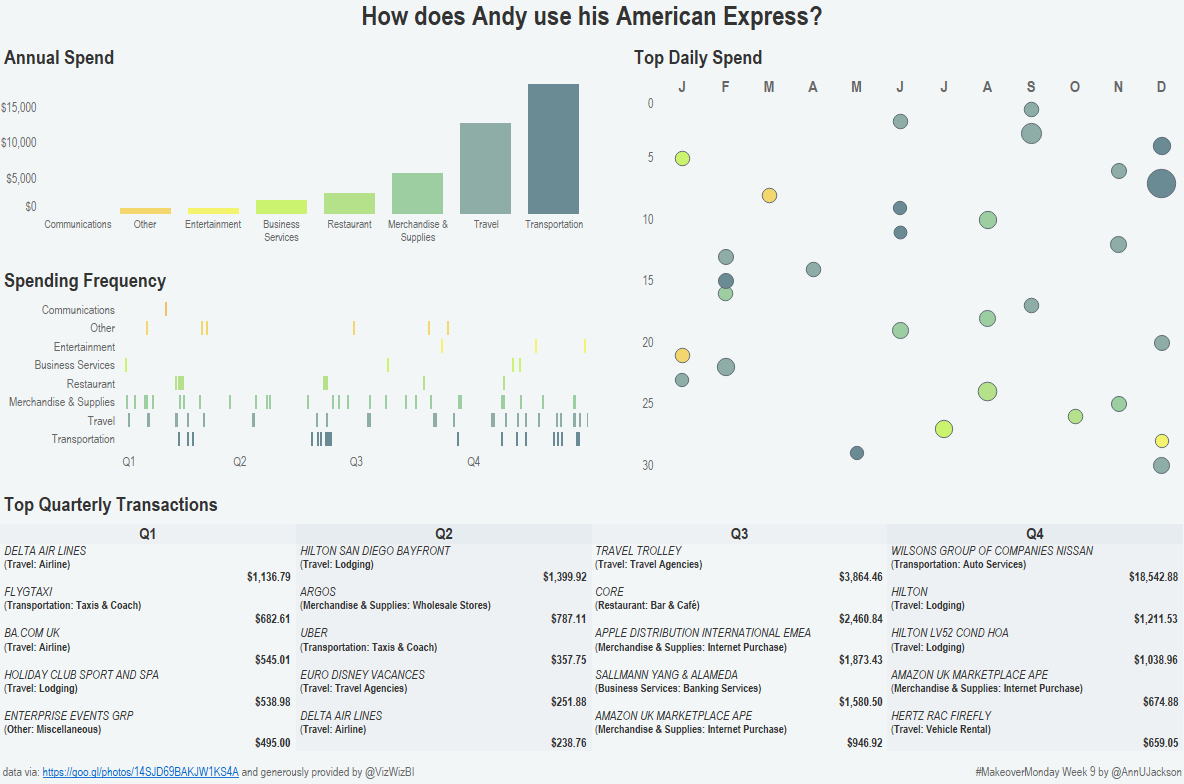
Makeover Monday Week 9 – Andy’s AMEX
So I started my dream job at the beginning of February. This means I’ve been spending the month adjusting and tweaking my personal schedule and working on bringing back good habits. In particular – I’ve missed out on doing daily workouts and consistently blogging about data viz. Fortunately I’ve been keeping up with the practice…
-
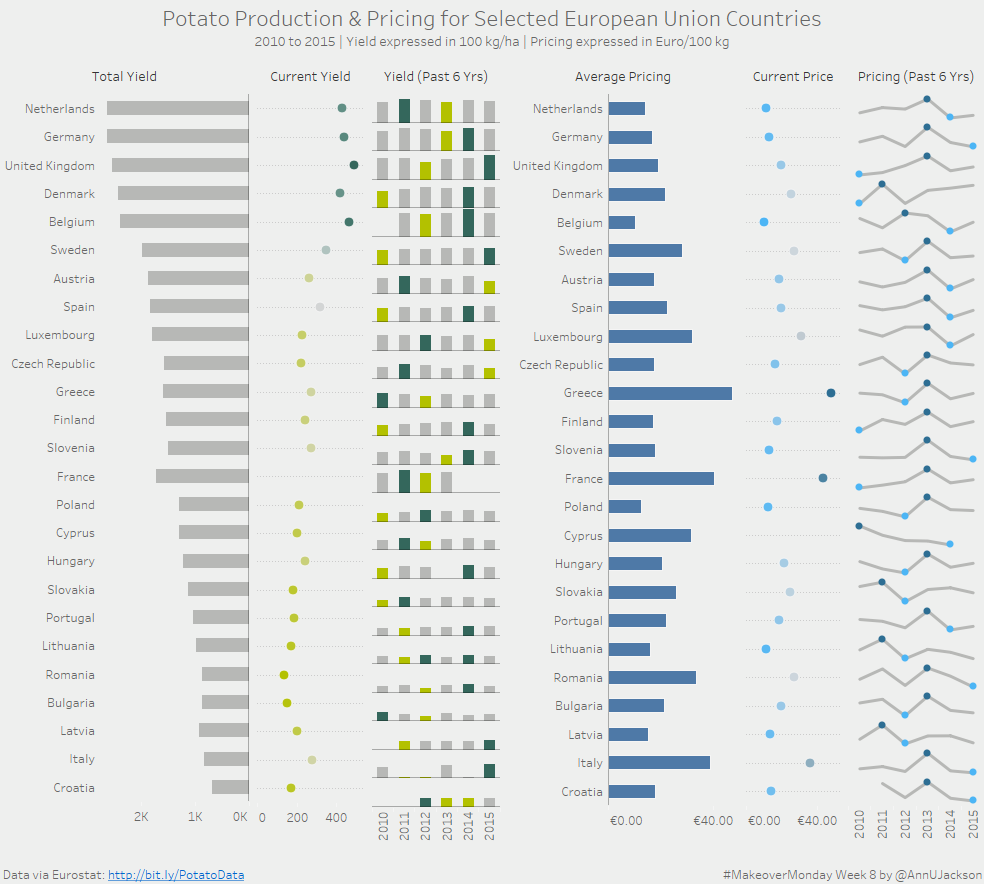
Makeover Monday Week 8 – Potatoes in the EU
I’ll say this first – I don’t eat potatoes. Although potatoes are super tasty, I refuse to have them as part of my diet. So I was less than thrilled about approaching a week that was pure potato (especially coming off the joy of Valentine’s Day). Nonetheless – it presented itself with a perfect opportunity…
-
Book Binge – January Edition
It’s time for another edition of book binge – a random category of blog posts devised (and now only on its second iteration) where I walk through the different books I’ve read and purchased this month. First – a personal breakthrough! I have always been an avid reader, but admittedly become lazy in recent years.…
-

The Flow of Human Migration
Today I decided to take a bit of a detour while working on a potential project for #VizForSocialGood. I was focused on a data set provided by UNICEF that showed the number of migrants from different areas/regions/countries to destination regions/countries. I’m pretty sure it is the direct companion to a chord diagram that UNICEF published…
-
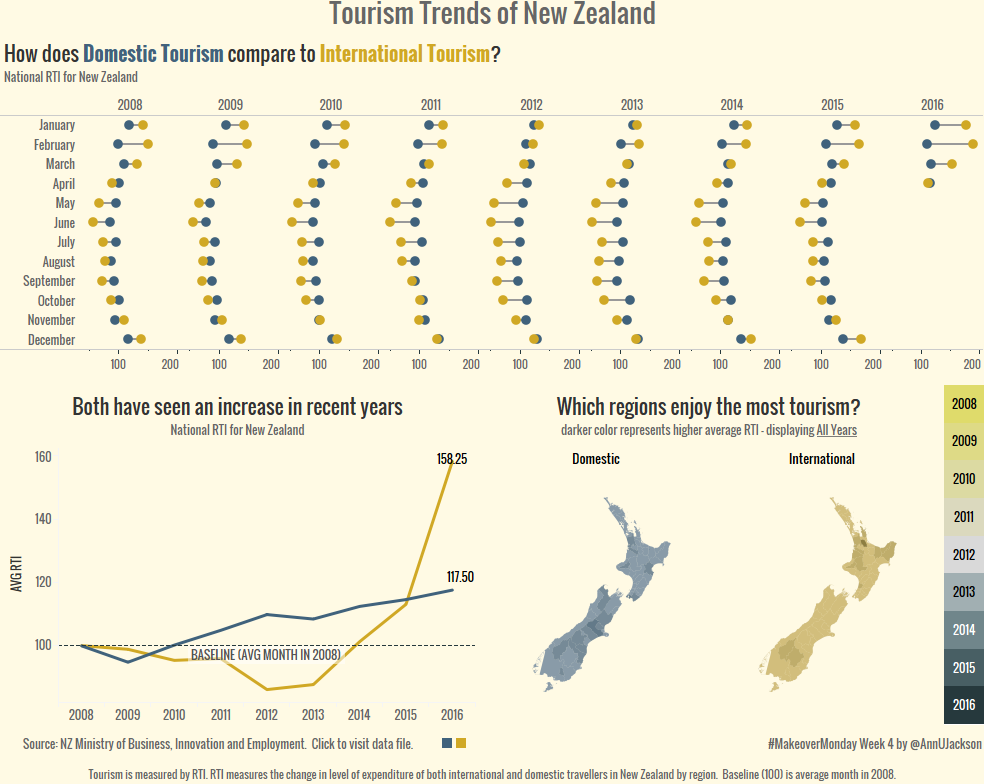
Makeover Monday 2017 – Week 4 New Zealand Tourism
This week’s Makeover was addressing Domestic and International tourism trend in New Zealand. No commentary provided with the data set, the original was just 2 charts left to the user to interpret. See Eva’s tweet for the originals: For #MakeoverMonday Wk 4 we look at the Regional Tourism Index in #NewZealand. Data definitions included 😉https://t.co/r5VbFem6T2…
-
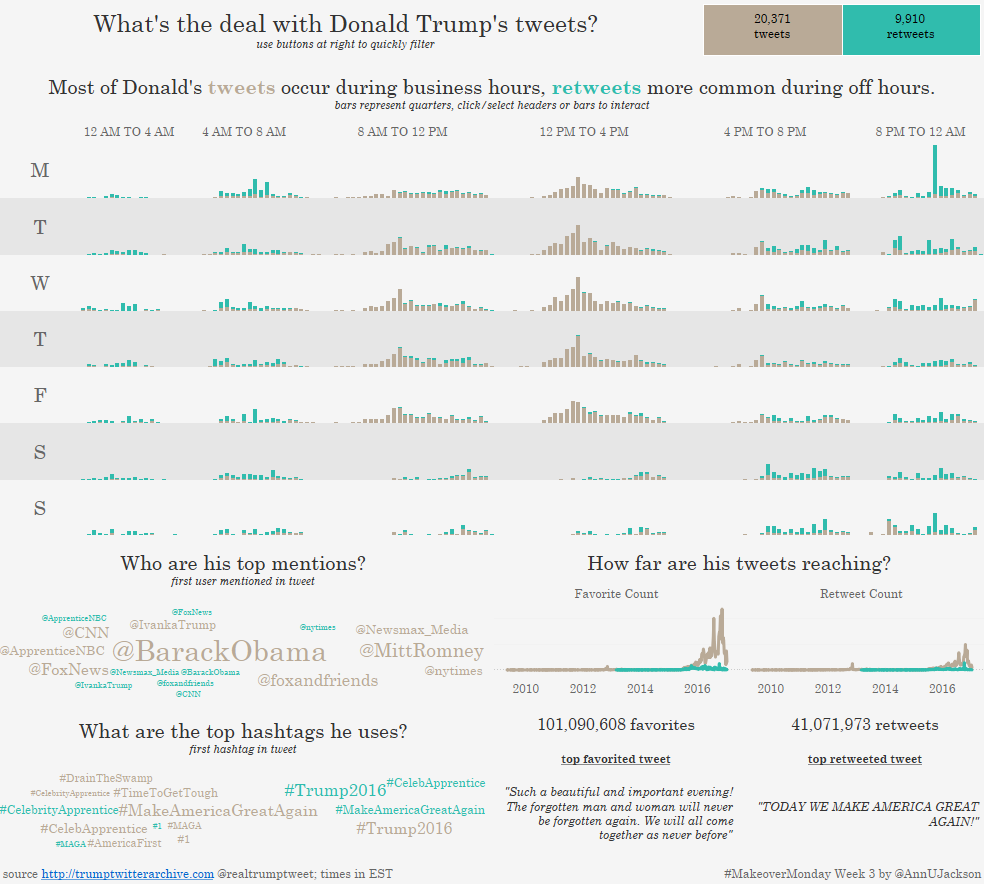
Makeover Monday 2017 – Week 3 Trump Tweets
**Update (1/20/17) : The original data set had a date formatting snafu resulting in 1307 tweets at the 12:00-12:59 PM (UTC time) hour to be displayed as 00:00-00:59 (aka 12 AM hour). This affected 4.3% of the original data set visualization and has been corrected. I have also added a footnote denoting the visualization is…
-
#DataResolutions – More than a hashtag
This gem of a blog post appeared on Tableau Public and within my twitter feed earlier this week asking what my #DataResolutions are. Here was my lofty response: My #DataResolutions: learn, grow, and share via #MakeoverMonday, #WorkoutWednesday, #phxtug, @thedatamashup, #datapluswomen project, & blog — Ann Jackson (@AnnUJackson) January 12, 2017 Sound like a ton…