Author: Ann Jackson
-
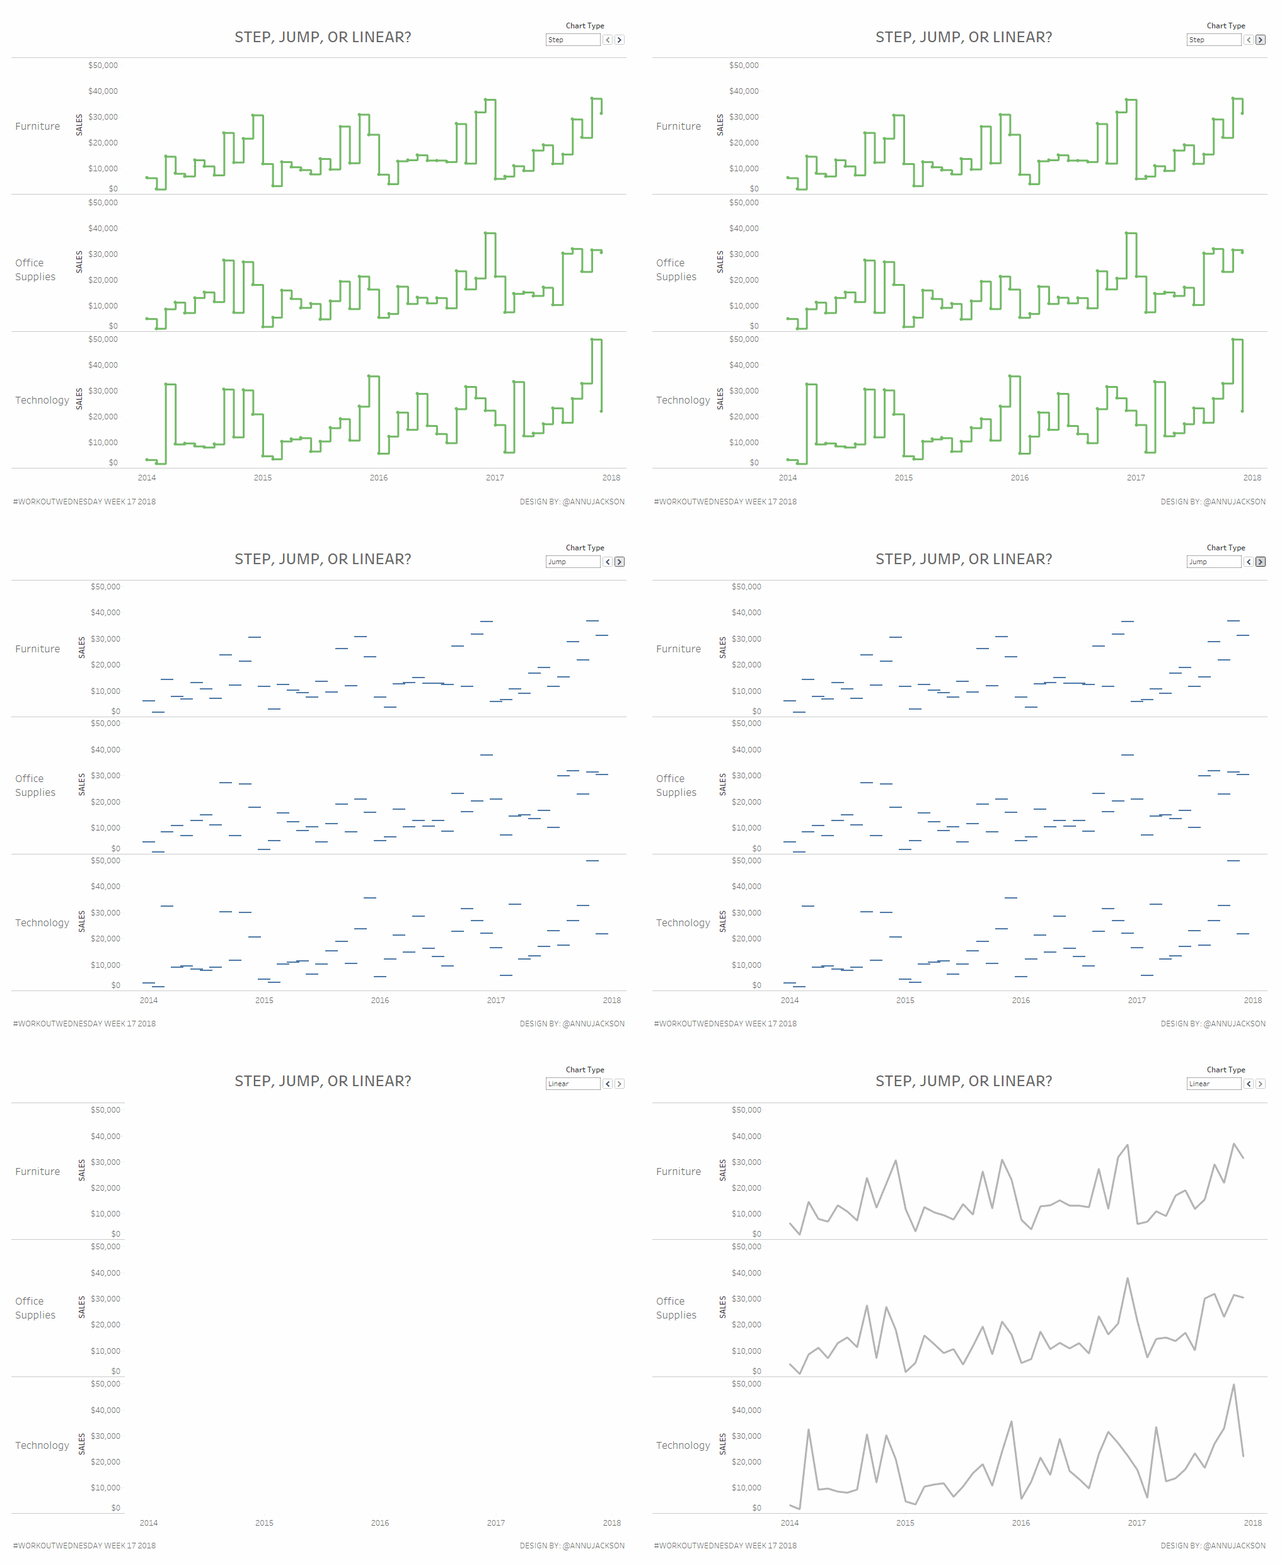
Workout Wednesday Week 17: Step, Jump, or Linear?
What better way to celebrate the release of step lines and jump lines in Tableau Desktop with a workout aimed at doing them the hard way? Using alternative line charts can be a great way to have more meaningful visual displays of not-so-continuous information. Or continuous information where it may not be best to display…
-
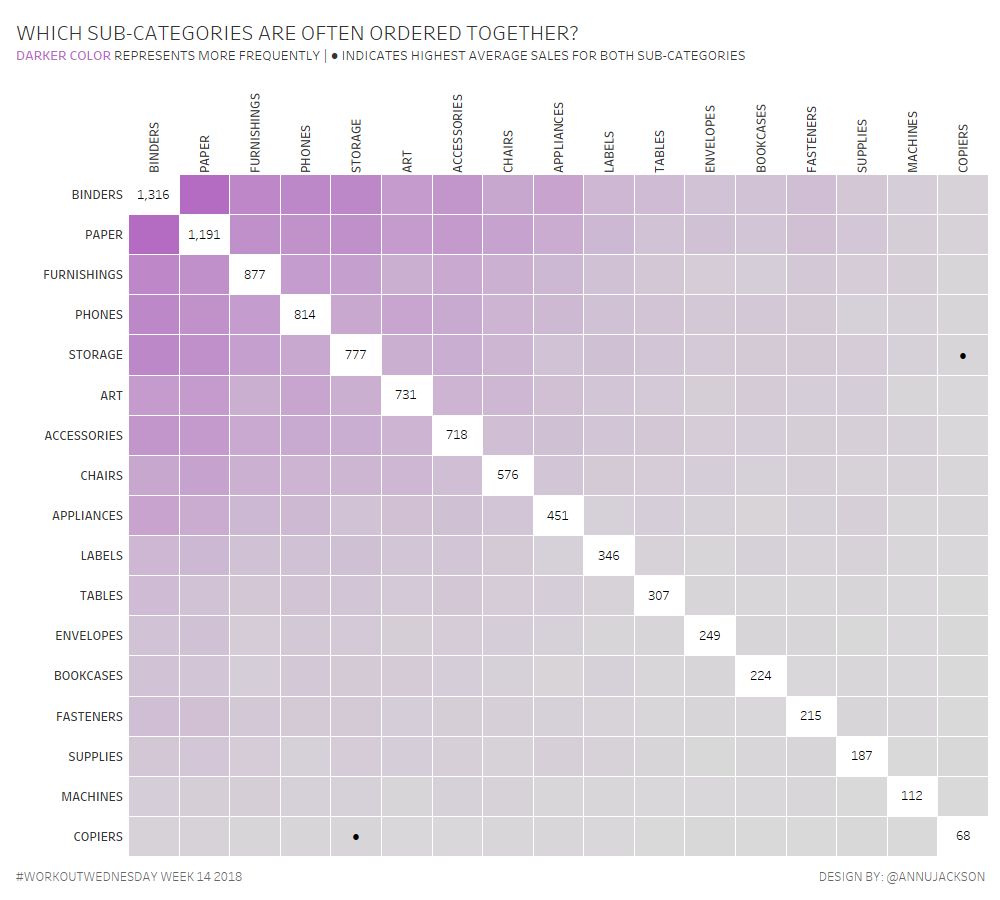
Workout Wednesday 14 | Guest Post | Frequency Matrix
Earlier in the month Luke Stanke asked if I would write a guest post and workout. As someone who completed all 52 workouts in 2017, the answer was obviously YES! This week I thought I’d take heavy influence from a neat little chart made to accompany Makeover Monday (w36y2017) – the Frequency Matrix. I call…
-
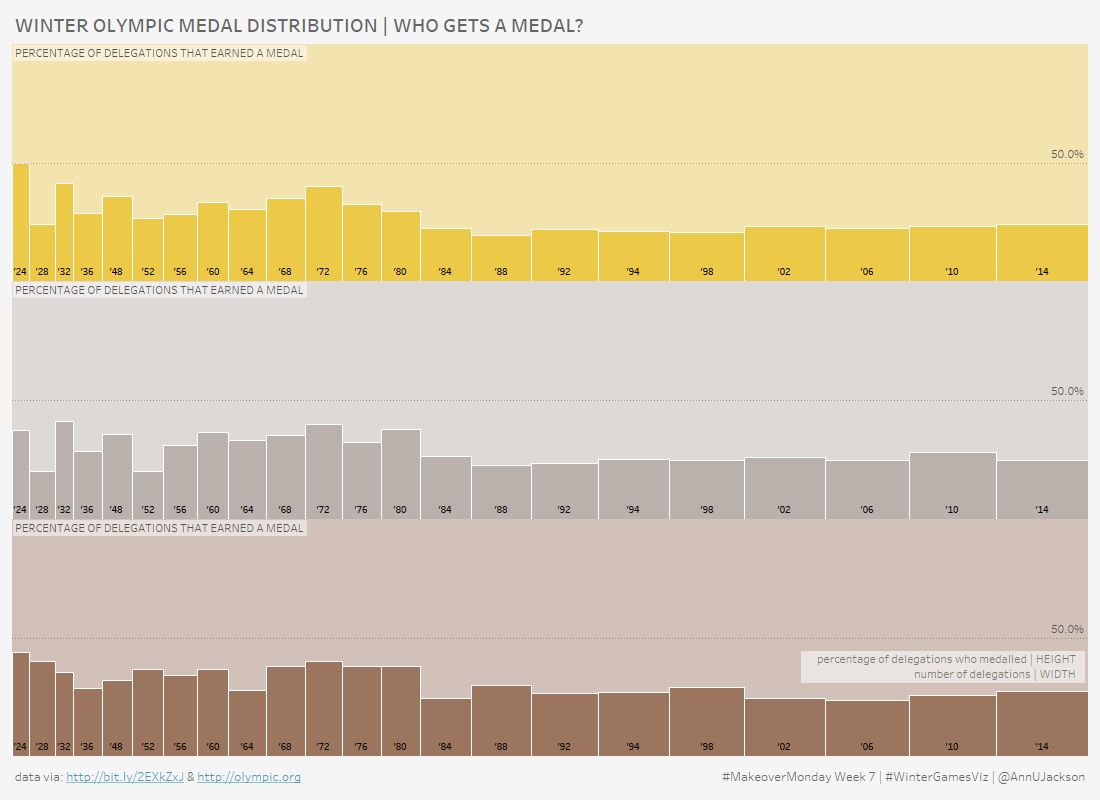
Who Gets an Olympic Medal | #MakeoverMonday Week 7
At the time of writing the 2018 Winter Olympic Games are in full force, so it seems only natural that the #MakeoverMonday topic for Week 7 of this year is record level results of Winter Games medal wins. I have to say that I was particularly excited to dive into this data set. Here’s what…
-

Go Give Back: Tableau Foundation Service Corp
Recently I had the opportunity to finish my first Tableau Foundation Service Corp consult. Something that’s been 2 years in the making. Since my early exposure to the Tableau community I’ve wanted to be actively involved in the Tableau Foundation – so I was delighted when I received an email in November expressing that they’ve…
-
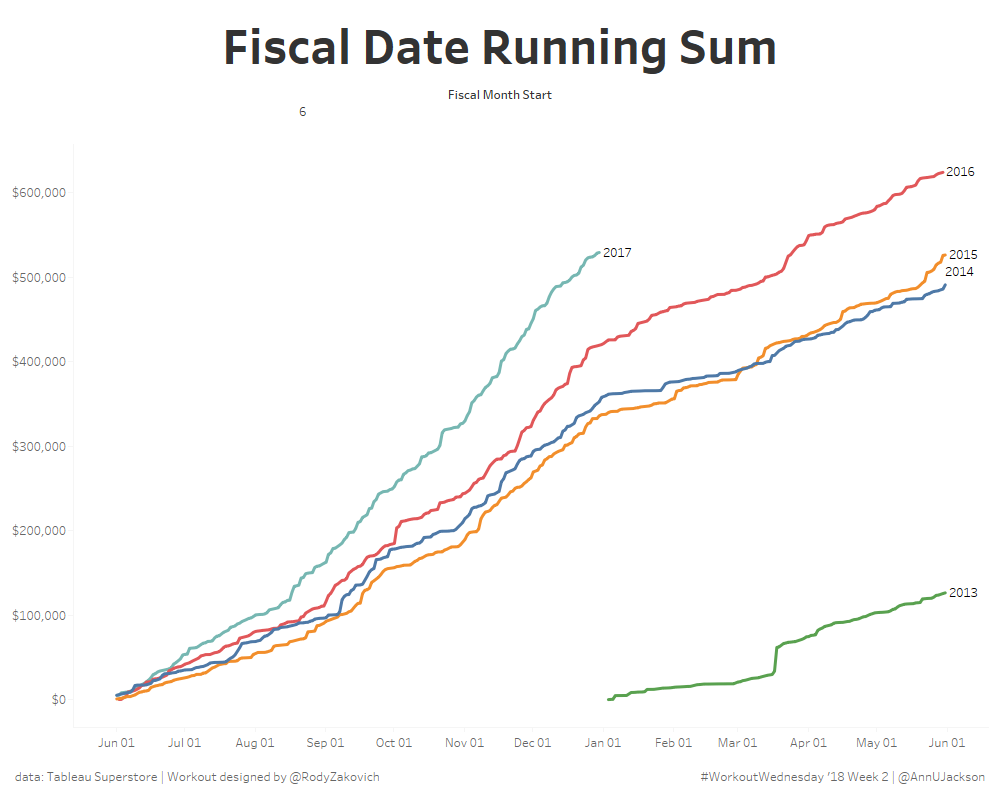
#Workout Wednesday – Fiscal Years + Running Sums
As a big advocate of #WorkoutWednesday I am excited to see that it is continuing on in 2018. I champion the initiative because it offers people a constructive way to problem solve, learn, and grow using Tableau. I was listening to this lecture yesterday and there was a great snippet “context is required to spark…
-
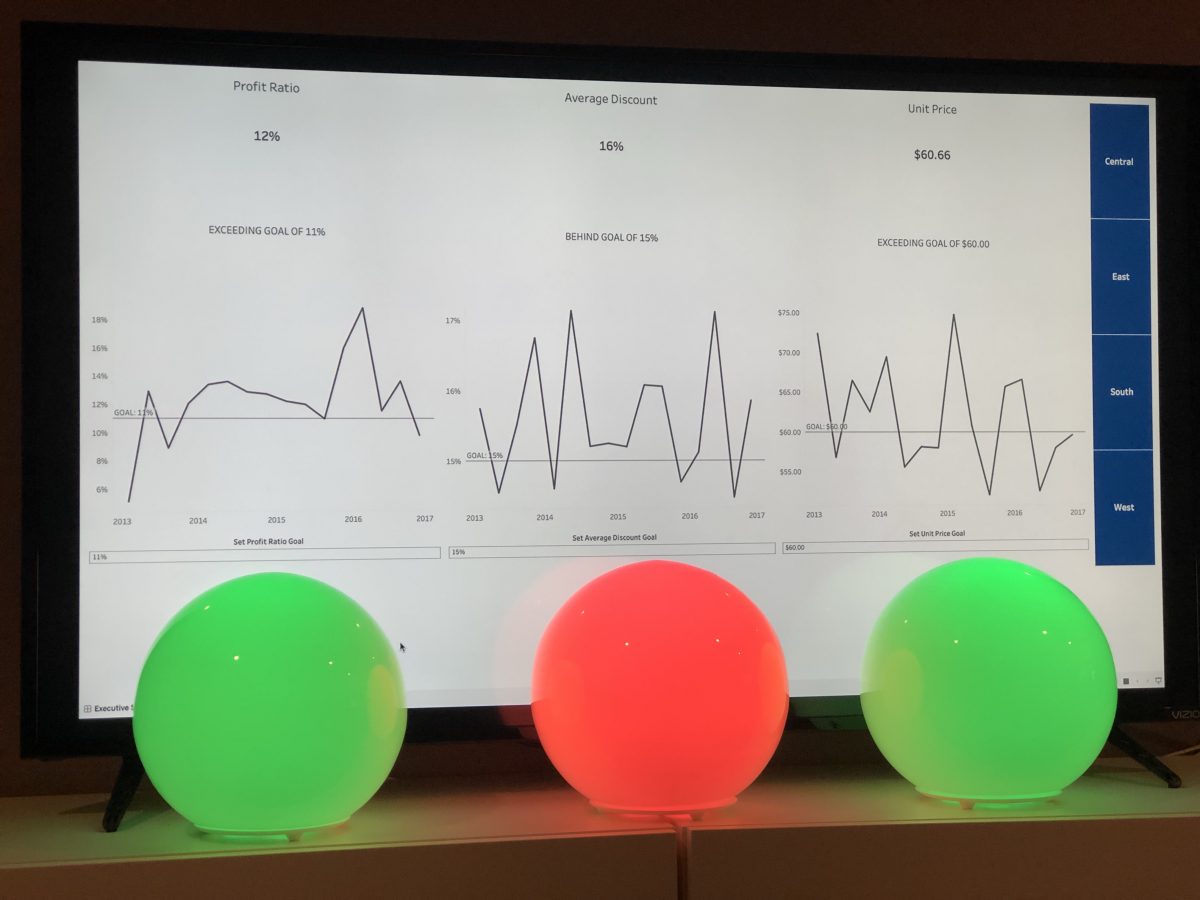
Tableau + Python + IoT
You’ve asked and it’s time to answer. About a week ago I posted a teaser video on Twitter that showed how I integrated my home automation system with a Tableau dashboard. The outcome of the video was dynamically changing three different lights in conjunction with KPI results. So beyond the “hey this is really cool”…
-
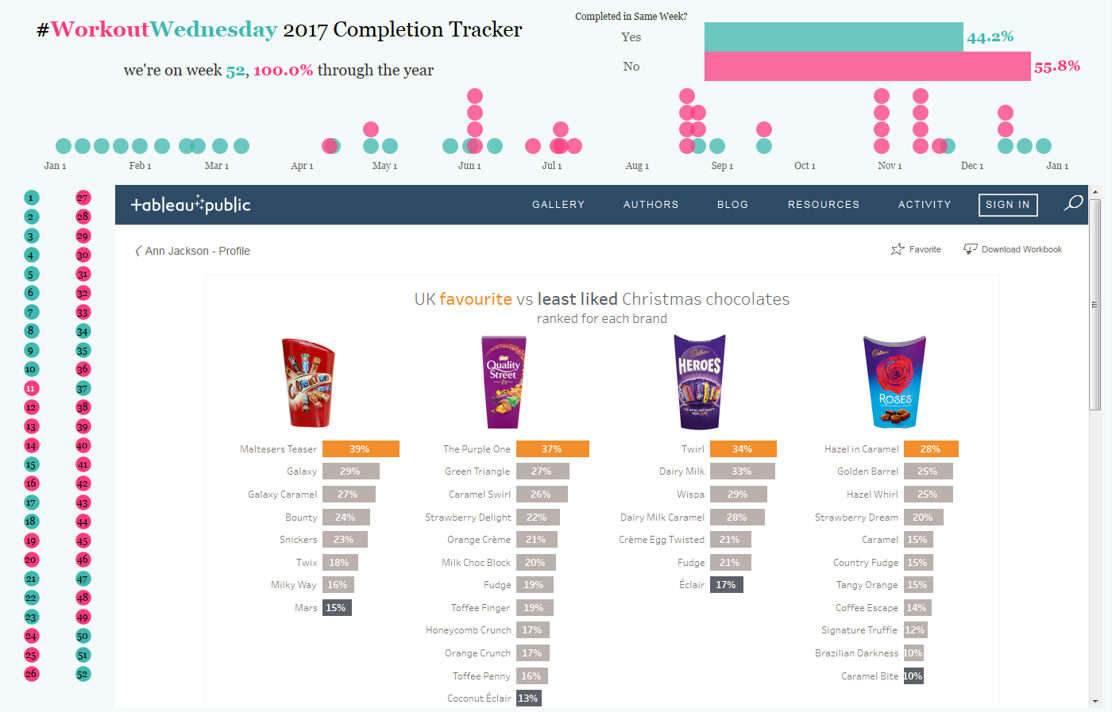
The Remaining 25 Weeks of #WorkoutWednesday
Back in July I wrote the first half of this blog post – it was about the first 27 weeks of #WorkoutWednesday. The important parts to remember (if the read is too long) are that I made a commitment to follow through and complete every #MakeoverMonday and #WorkoutWednesday in 2017. The reason was pretty straightforward…
-

Exploring Python + Tableau
This month I’ve been taking a night class at Galvanize aimed at being an introductory to Python and Data Science. It’s a 4 night/week boot camp with a mix of lecture and hands-on assignments. My primary interest with the course was the data science component, but I also felt extremely strong about the necessity to…
-
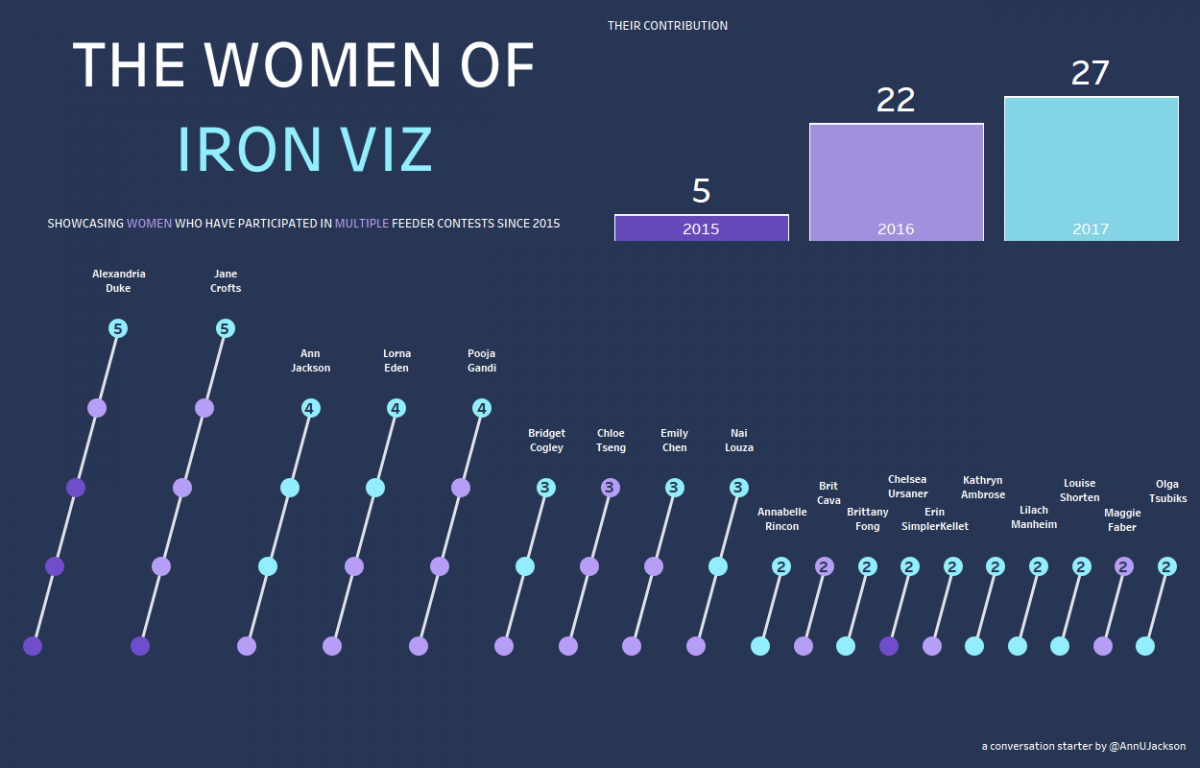
A follow up to The Women of #IronViz
It’s now 5 days removed from the Tableau Conference (#data17) and the topic of women in data visualization and the particularly pointed topic of women competing in Tableau’s #IronViz competition is still fresh on everyone’s mind. First – I think it’s important to recognize how awesome the community reception of this topic has been. Putting…
-
#data17 Recap – A quick top 5
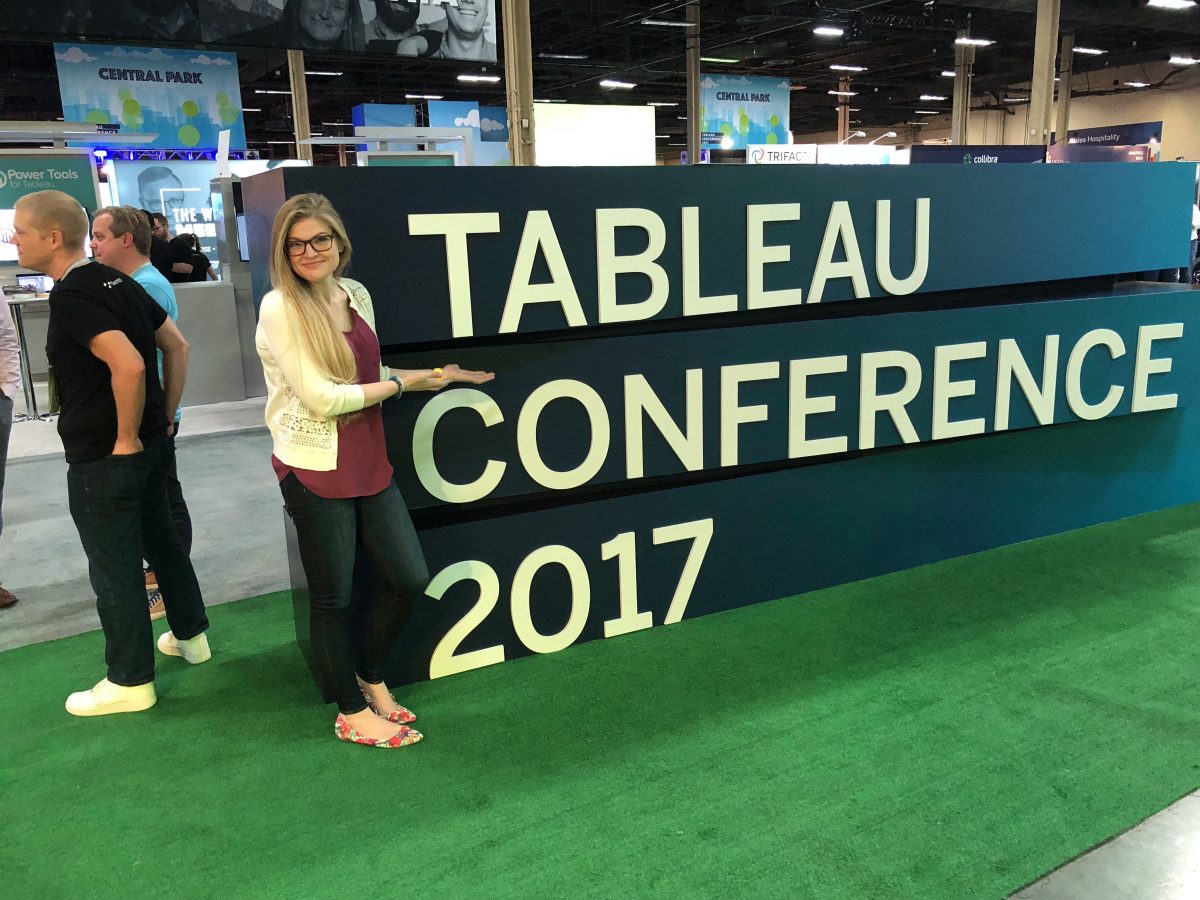
Now that Tableau Conference 2017 has come to a close it’s time to reflect back on my favorite and most memorable moments. I’ll preface by saying that I had very lofty goals for this conference. It started after #data16 – immediately after the conference I did some significant thought work on what I wanted my…