Tag: tableau
-
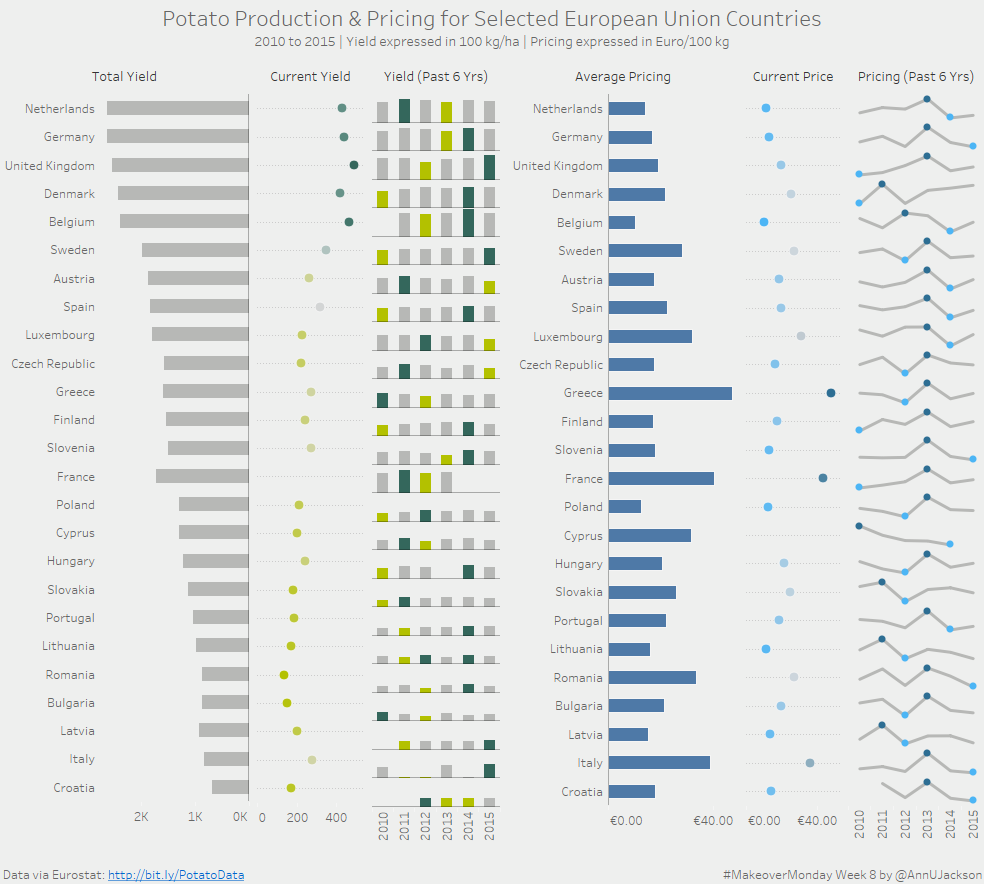
Makeover Monday Week 8 – Potatoes in the EU
I’ll say this first – I don’t eat potatoes. Although potatoes are super tasty, I refuse to have them as part of my diet. So I was less than thrilled about approaching a week that was pure potato (especially coming off the joy of Valentine’s Day). Nonetheless – it presented itself with a perfect opportunity…
-
And so it beings – Adventures in Python
Tableau 10.2 is on the horizon and with it comes several new features – one that is of particular interest to me is their new Python integration. Here’s the Beta program beauty shot: Essentially what this will mean is that more advanced programming languages aimed at doing more sophisticated analysis will become an easy to…
-
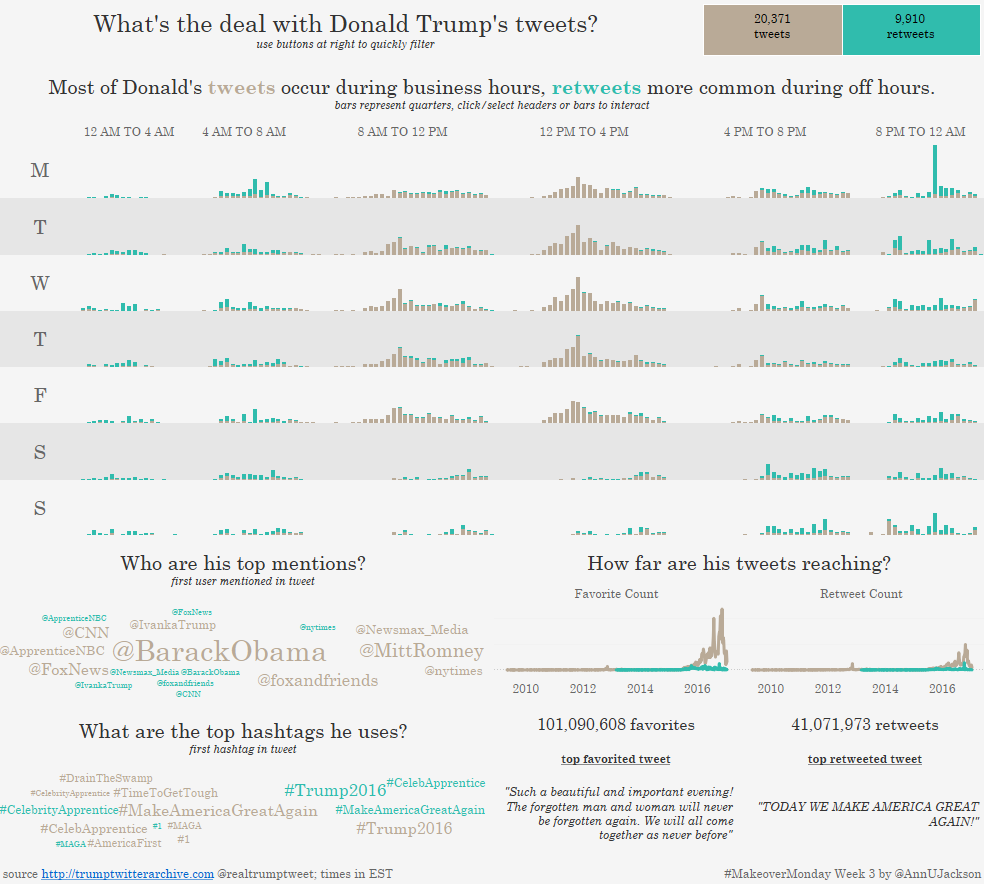
Makeover Monday 2017 – Week 3 Trump Tweets
**Update (1/20/17) : The original data set had a date formatting snafu resulting in 1307 tweets at the 12:00-12:59 PM (UTC time) hour to be displayed as 00:00-00:59 (aka 12 AM hour). This affected 4.3% of the original data set visualization and has been corrected. I have also added a footnote denoting the visualization is…
-
#DataResolutions – More than a hashtag
This gem of a blog post appeared on Tableau Public and within my twitter feed earlier this week asking what my #DataResolutions are. Here was my lofty response: My #DataResolutions: learn, grow, and share via #MakeoverMonday, #WorkoutWednesday, #phxtug, @thedatamashup, #datapluswomen project, & blog — Ann Jackson (@AnnUJackson) January 12, 2017 Sound like a ton…
-
Makeover Monday 2017 – Week 2
It’s time for Makeover Monday – Week 2. This week’s data set was the quarterly sales (by units) of Apple iPhones for the past 10ish years. The original article accompanying the data indicated that the golden years of Apple may be over. So let me start by saying – I broke the rules (or rather,…
-
Makeover Monday 2017 – Week 1
It’s officially 2017 – the start of a new year. As such, this is a great time for anyone in the Tableau universe to make a fresh commitment to participate in the community challenge known as Makeover Monday. As I jump into this challenge, I’ve made the conscious decision to start with the things I…
-
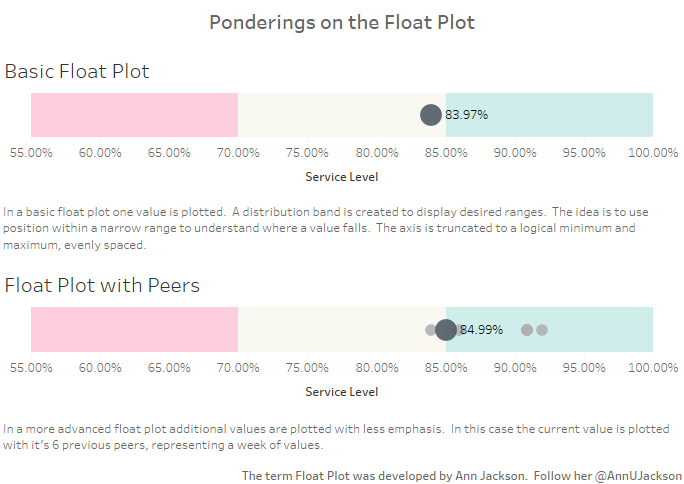
The Float Plot
One of the more interesting aspects of data visualization is how new visualization methods are created. There are several substantial charts, graphs, and plots out there that visualization artists typically rely on. As I’ve spent time reading more about data visualization, I started thinking about potential visualizations out there that could be added into the…
-
Statistical Process Control Charts
I’ve had this idea for a while now – create a blog post and video tutorial discussing what Statistical Process Control is and how to use different Control Chart “tests” in Tableau. I’ve spent a significant portion of my professional career in business process improvement and always like it when I can integrate techniques learned…
-
#MakeoverMonday 11/22/16 – Advanced Logging Edition
And it’s time – my first ever Makeover Monday. I’ll admit, I’ve attempted to catch up in the past, but always lost steam. I think the first data set might be related to sports and I struggle to focus on making something interesting. Despite my follies, I’m proud to say that I’ve participated in this…