Tag: tableau
-
#data16 Data Dump
Last night was our monthly Phoenix Tableau User Group (PHXTUG) meeting and as part of the post-excitement of Tableau’s 2016 conference we took some time to go through their strategy and some upcoming features. Full video is available here: Interested in reusing the slides? Find the deck here: TC 16 Data Dump from Ann Jackson
-
#data16 Day 3
Admittedly I’m jumping from day 1 to day 3. I hit a micro wall on Tuesday. But now that I’ve pushed through to Wednesday – it is time to focus on the amazing. First up – paradigm shift. I had a very novel vision of expectations and how to “get the most” out of the…
-
Prepping for #data16
The last 6 months have been a huge whirlwind for me in terms of Tableau and the Tableau community. I started out the year attending a Saturday workshop on Tableau and am now a Desktop Certified Professional and two month veteran Tableau User Group leader. The whirlwind has been part of my 2016 vision – to…
-
Funnel Plots
As I continue to read through Stephen Few’s “Signal: Understanding What Matters in a World of Noise” there have been some new charts or techniques I’ve come across. In an attempt to understand their purpose on a deeper level (and implement them in my professional life), I’m on a mission to recreate them in Tableau.…
-
Thoughts on sorting in Tableau
Now with video 🙂 Last week I ran into an interesting situation with Tableau. I wanted to sort dimensions within larger dimensions by a measure. After that sort, I wanted to encode an additional dimension on color. Here’s what that would look like using Superstore: In the view I am looking at sub-categories by each…
-
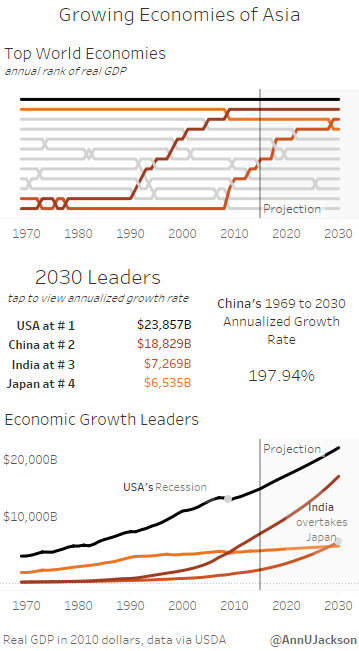
#IronViz Entry – Mobile Design
Part of being involved in the Tableau community means publicly publishing visualizations to learn and grow. It’s also a great way to find inspiration. As I’ve pushed myself to be more active within the local Phoenix Tableau community and social (Twitter) community, I knew it was time to “step up” and make an Iron Viz.…