Tag: workout wednesday
-
Workout Wednesday Week 17: Step, Jump, or Linear?
What better way to celebrate the release of step lines and jump lines in Tableau Desktop with a workout aimed at doing them the hard way? Using alternative line charts can be a great way to have more meaningful visual displays of not-so-continuous information. Or continuous information where it may not be best to display…
-
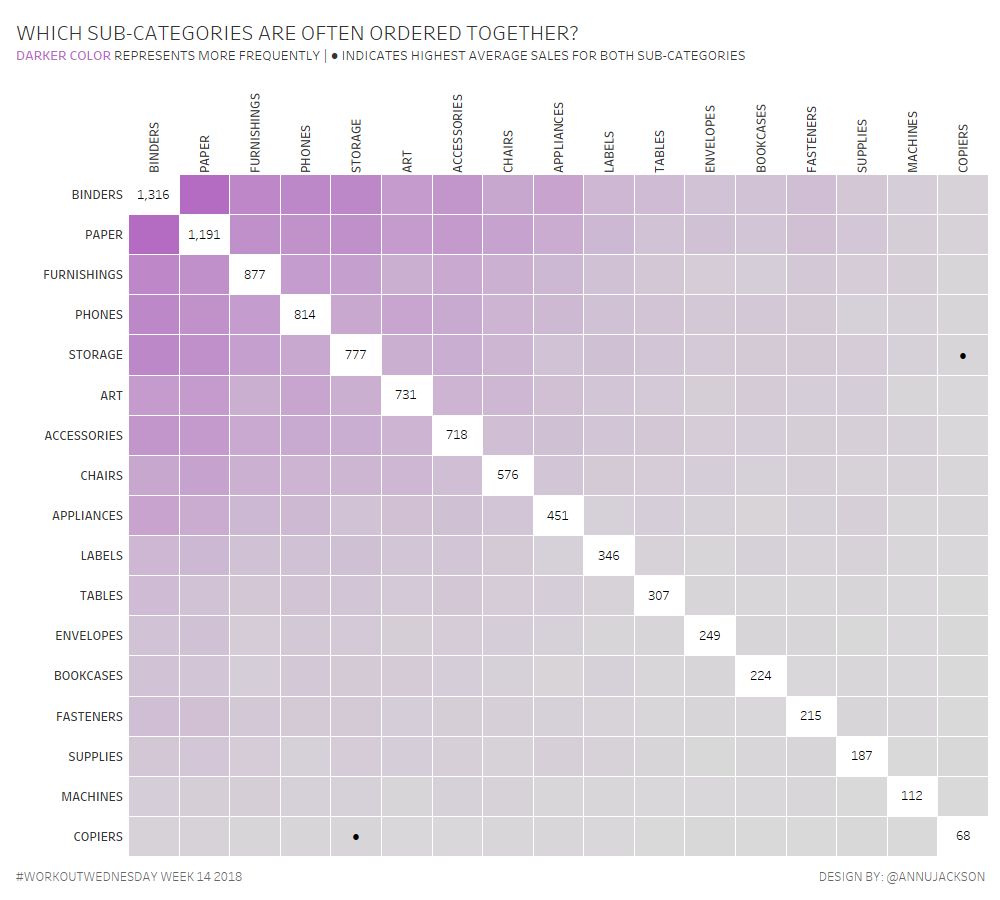
Workout Wednesday 14 | Guest Post | Frequency Matrix
Earlier in the month Luke Stanke asked if I would write a guest post and workout. As someone who completed all 52 workouts in 2017, the answer was obviously YES! This week I thought I’d take heavy influence from a neat little chart made to accompany Makeover Monday (w36y2017) – the Frequency Matrix. I call…
-
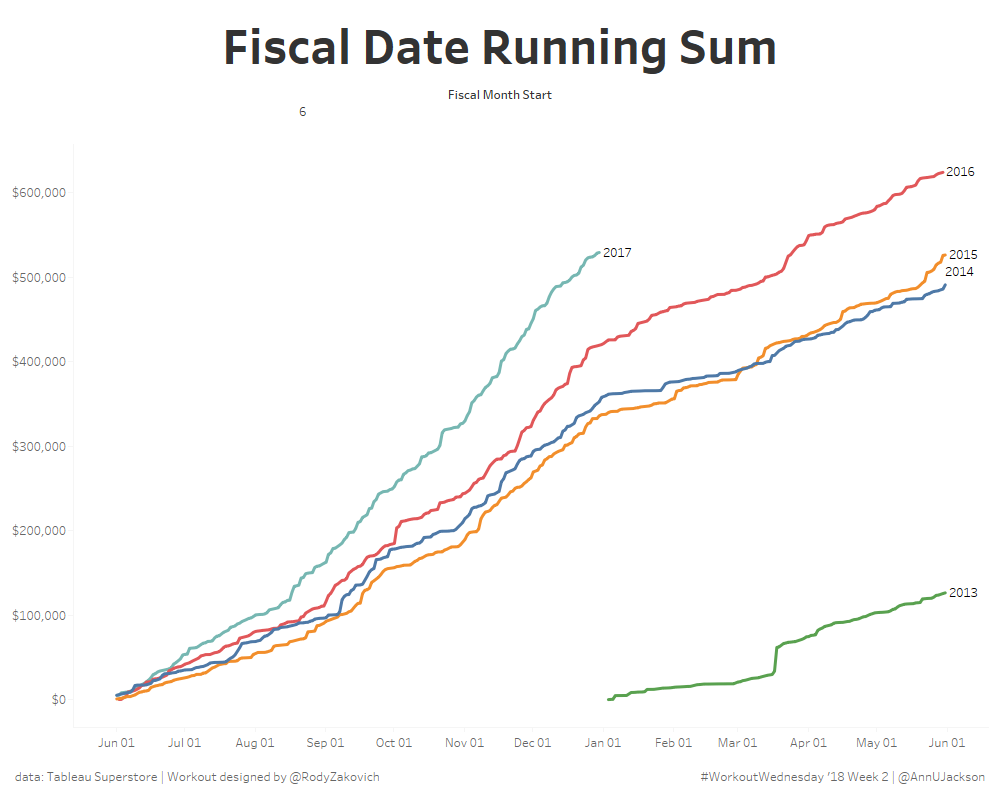
#Workout Wednesday – Fiscal Years + Running Sums
As a big advocate of #WorkoutWednesday I am excited to see that it is continuing on in 2018. I champion the initiative because it offers people a constructive way to problem solve, learn, and grow using Tableau. I was listening to this lecture yesterday and there was a great snippet “context is required to spark…
-
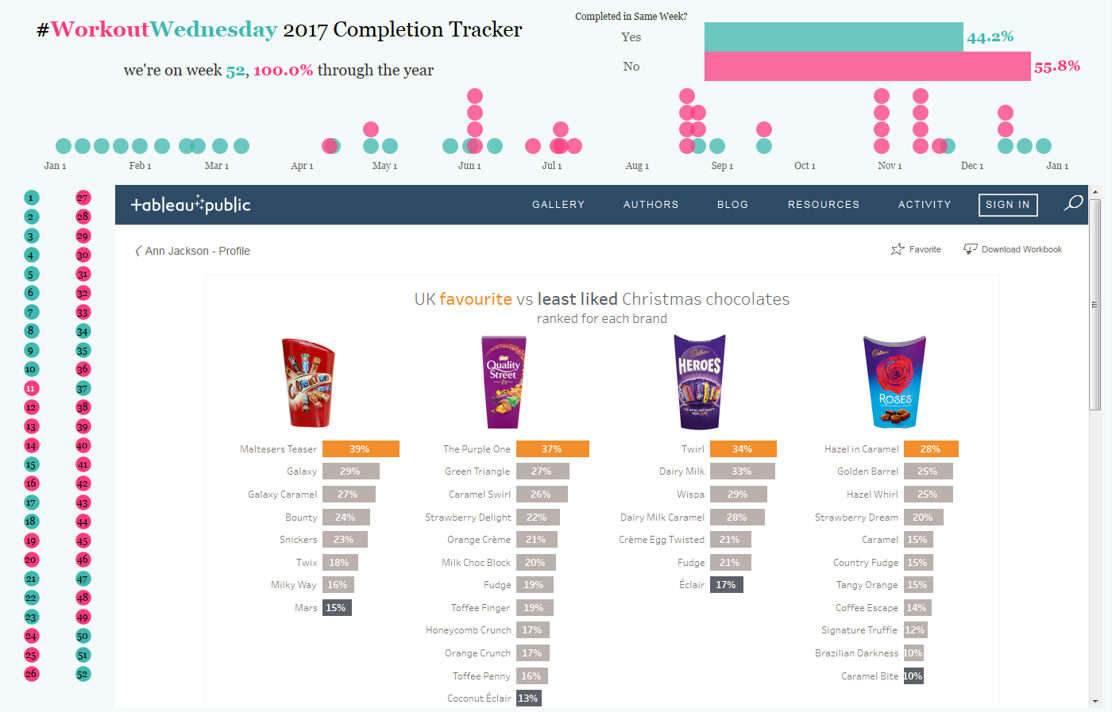
The Remaining 25 Weeks of #WorkoutWednesday
Back in July I wrote the first half of this blog post – it was about the first 27 weeks of #WorkoutWednesday. The important parts to remember (if the read is too long) are that I made a commitment to follow through and complete every #MakeoverMonday and #WorkoutWednesday in 2017. The reason was pretty straightforward…
-
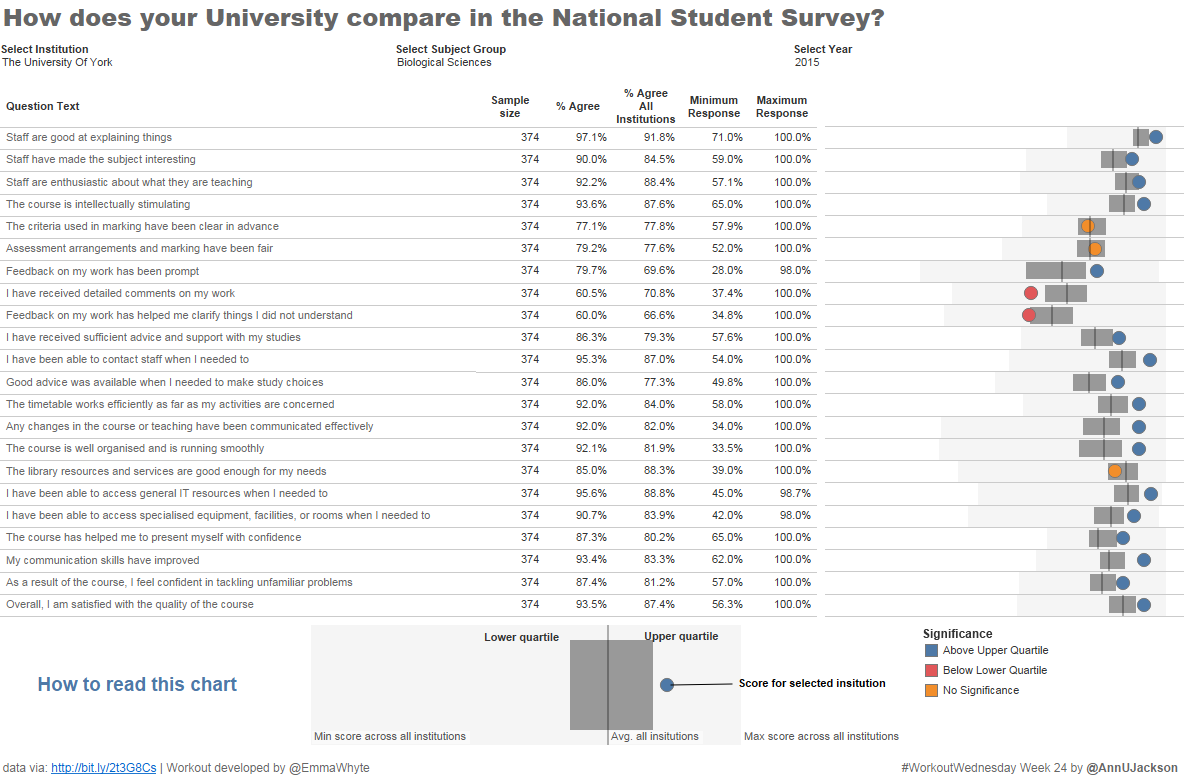
#WorkoutWednesday Week 24 – Math Musings
The Workout Wednesday for week 24 is a great way to represent where a result for a particular value falls with respect to a broader collection. I’ve used a spine chart recently on a project where most data was centered around certain points and I wanted to show the range. Propagating maximums, minimums, averages, quartiles,…
-
#WorkoutWednesday Week 23 – American National Parks
I’m now back in full force from an amazing analytics experience at the Alteryx Inspire conference in Las Vegas. The week was packed with learning, inspiration, and community – things I adore and am honored to be a part of. Despite the awesome nature of the event, I have to admit I’m happy to be…
-
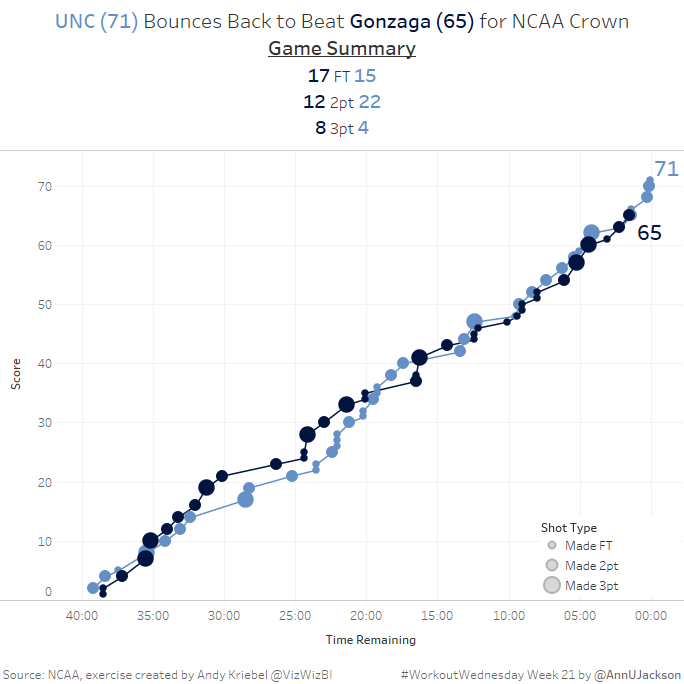
Workout Wednesday Week 21 – Part 1 (My approach to existing structure)
This week’s Workout Wednesday had us taking NCAA data and developing a single chart that showed the cumulative progression of a basketball game. More specifically a line chart where the X axis is countdown of time and the Y axis is current score. There’s some additional detail in the form of the size of each…
-
#WorkoutWednesday Week 1
Another great community activity is Workout Wednesday hosted by Andy Kriebel and Emma Whyte. According to Andy it’s “designed to test your knoweldge of Tableau and help you kick on in your development.” They’re alternating odd vs. even weeks. Here’s the first task in a visual nutshell (using Superstore data set): I’m happy to say…