Category: Data
-
Book Binge – December Edition
I typically spend the end of my year self reflecting on how things have gone – both the good and the bad. Usually that leads me to this thoughtful place of “I need more books.” For some reason to me books are instant inspiration and a great alternative to binge streaming. They remind me of…
-
How do you add value through data analytics?
I recently read this article that really ignited a lot of thoughts that often swirl around in my mind. If you were to ask me what my drive is, it’s making data-informed, data-driven decisions. My mechanism for this is through data visualization. More broadly than that, it is communicating complex ideas in a visual manner.…
-
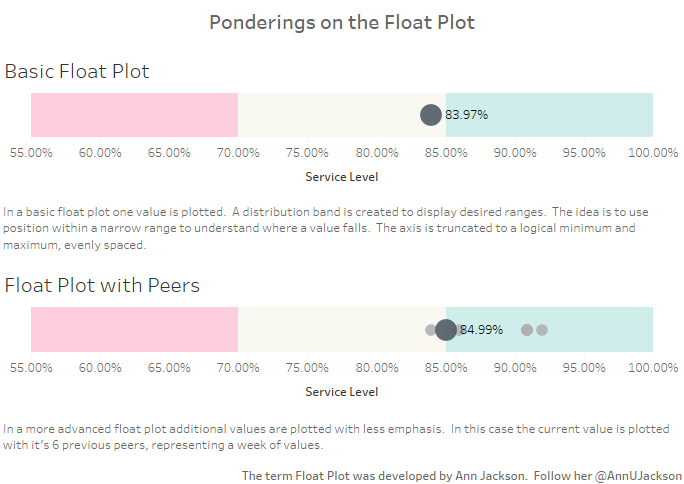
The Float Plot
One of the more interesting aspects of data visualization is how new visualization methods are created. There are several substantial charts, graphs, and plots out there that visualization artists typically rely on. As I’ve spent time reading more about data visualization, I started thinking about potential visualizations out there that could be added into the…
-
Statistical Process Control Charts
I’ve had this idea for a while now – create a blog post and video tutorial discussing what Statistical Process Control is and how to use different Control Chart “tests” in Tableau. I’ve spent a significant portion of my professional career in business process improvement and always like it when I can integrate techniques learned…
-
#MakeoverMonday 11/22/16 – Advanced Logging Edition
And it’s time – my first ever Makeover Monday. I’ll admit, I’ve attempted to catch up in the past, but always lost steam. I think the first data set might be related to sports and I struggle to focus on making something interesting. Despite my follies, I’m proud to say that I’ve participated in this…
-
#data16 Data Dump
Last night was our monthly Phoenix Tableau User Group (PHXTUG) meeting and as part of the post-excitement of Tableau’s 2016 conference we took some time to go through their strategy and some upcoming features. Full video is available here: Interested in reusing the slides? Find the deck here: TC 16 Data Dump from Ann Jackson
-
#data16 Day 3
Admittedly I’m jumping from day 1 to day 3. I hit a micro wall on Tuesday. But now that I’ve pushed through to Wednesday – it is time to focus on the amazing. First up – paradigm shift. I had a very novel vision of expectations and how to “get the most” out of the…
-
#data16 Day 1
What better way to commemorate my first day at #data16 than sharing the highs, lows – what has met expectations and what I didn’t expect. The community – Probably the one thing I couldn’t anticipate coming into #data16 was how the virtual community (mainly via Twitter) compared to reality. Like internet dating, you never really…
-
Prepping for #data16
The last 6 months have been a huge whirlwind for me in terms of Tableau and the Tableau community. I started out the year attending a Saturday workshop on Tableau and am now a Desktop Certified Professional and two month veteran Tableau User Group leader. The whirlwind has been part of my 2016 vision – to…