Category: Data
-
Book Binge – January Edition
It’s time for another edition of book binge – a random category of blog posts devised (and now only on its second iteration) where I walk through the different books I’ve read and purchased this month. First – a personal breakthrough! I have always been an avid reader, but admittedly become lazy in recent years.…
-

The Flow of Human Migration
Today I decided to take a bit of a detour while working on a potential project for #VizForSocialGood. I was focused on a data set provided by UNICEF that showed the number of migrants from different areas/regions/countries to destination regions/countries. I’m pretty sure it is the direct companion to a chord diagram that UNICEF published…
-
And so it beings – Adventures in Python
Tableau 10.2 is on the horizon and with it comes several new features – one that is of particular interest to me is their new Python integration. Here’s the Beta program beauty shot: Essentially what this will mean is that more advanced programming languages aimed at doing more sophisticated analysis will become an easy to…
-
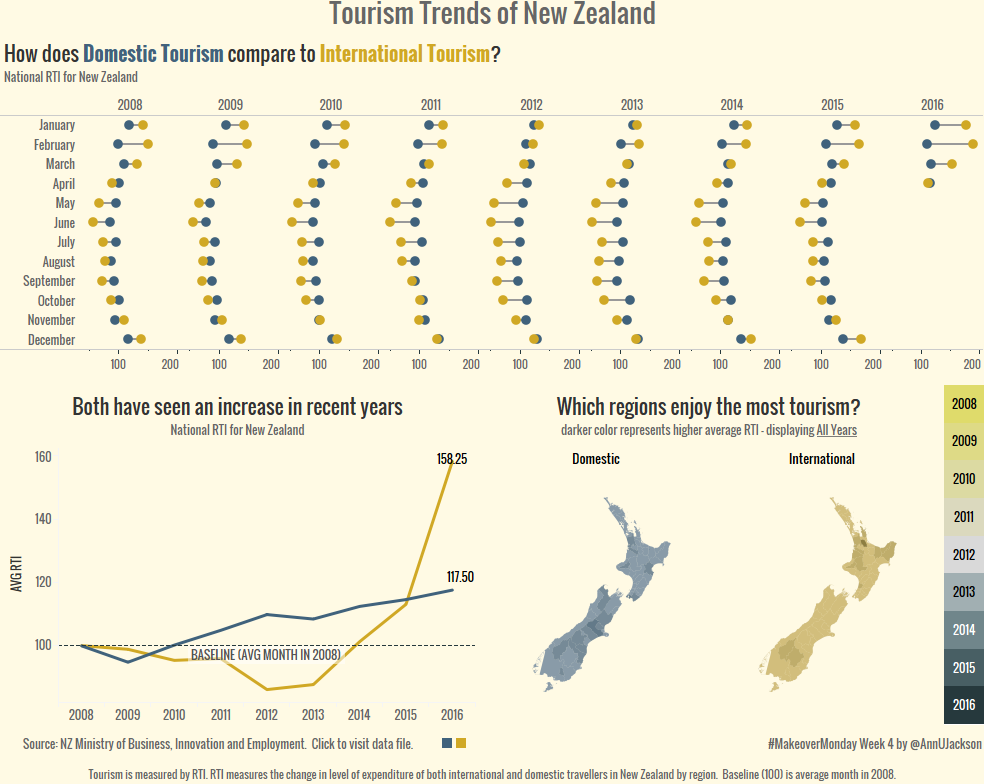
Makeover Monday 2017 – Week 4 New Zealand Tourism
This week’s Makeover was addressing Domestic and International tourism trend in New Zealand. No commentary provided with the data set, the original was just 2 charts left to the user to interpret. See Eva’s tweet for the originals: For #MakeoverMonday Wk 4 we look at the Regional Tourism Index in #NewZealand. Data definitions included 😉https://t.co/r5VbFem6T2…
-
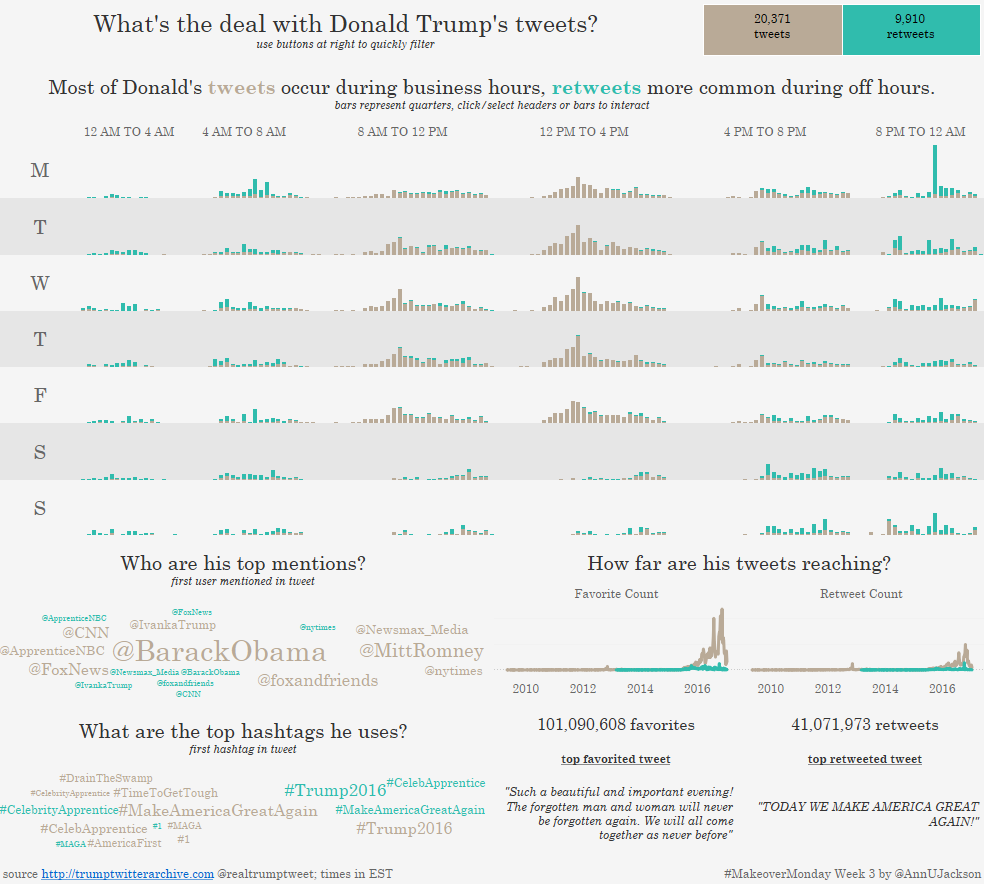
Makeover Monday 2017 – Week 3 Trump Tweets
**Update (1/20/17) : The original data set had a date formatting snafu resulting in 1307 tweets at the 12:00-12:59 PM (UTC time) hour to be displayed as 00:00-00:59 (aka 12 AM hour). This affected 4.3% of the original data set visualization and has been corrected. I have also added a footnote denoting the visualization is…
-
#DataResolutions – More than a hashtag
This gem of a blog post appeared on Tableau Public and within my twitter feed earlier this week asking what my #DataResolutions are. Here was my lofty response: My #DataResolutions: learn, grow, and share via #MakeoverMonday, #WorkoutWednesday, #phxtug, @thedatamashup, #datapluswomen project, & blog — Ann Jackson (@AnnUJackson) January 12, 2017 Sound like a ton…
-
Makeover Monday 2017 – Week 2
It’s time for Makeover Monday – Week 2. This week’s data set was the quarterly sales (by units) of Apple iPhones for the past 10ish years. The original article accompanying the data indicated that the golden years of Apple may be over. So let me start by saying – I broke the rules (or rather,…
-
#WorkoutWednesday Week 1
Another great community activity is Workout Wednesday hosted by Andy Kriebel and Emma Whyte. According to Andy it’s “designed to test your knoweldge of Tableau and help you kick on in your development.” They’re alternating odd vs. even weeks. Here’s the first task in a visual nutshell (using Superstore data set): I’m happy to say…
-
Makeover Monday 2017 – Week 1
It’s officially 2017 – the start of a new year. As such, this is a great time for anyone in the Tableau universe to make a fresh commitment to participate in the community challenge known as Makeover Monday. As I jump into this challenge, I’ve made the conscious decision to start with the things I…