Category: Tableau
-
Prepping for #data16
The last 6 months have been a huge whirlwind for me in terms of Tableau and the Tableau community. I started out the year attending a Saturday workshop on Tableau and am now a Desktop Certified Professional and two month veteran Tableau User Group leader. The whirlwind has been part of my 2016 vision – to…
-
Funnel Plots
As I continue to read through Stephen Few’s “Signal: Understanding What Matters in a World of Noise” there have been some new charts or techniques I’ve come across. In an attempt to understand their purpose on a deeper level (and implement them in my professional life), I’m on a mission to recreate them in Tableau.…
-
Thoughts on sorting in Tableau
Now with video 🙂 Last week I ran into an interesting situation with Tableau. I wanted to sort dimensions within larger dimensions by a measure. After that sort, I wanted to encode an additional dimension on color. Here’s what that would look like using Superstore: In the view I am looking at sub-categories by each…
-
Dot Plots
Today I was reading Stephen Few’s Information Dashboard Design aloud while Josh was doing some fall PC clean up and was on the chapter “An Ideal Library of Graphs.” As Stephen describes it there are several charts or graphs that should make their way onto dashboards and he goes into detail on the reason behind…
-
Quick and easy – parameters to aggregate dates
(Now with video – video uses different data as an example) One of my favorite uses of parameters is to dynamically change date aggregations without the pesky drill symbol. Sometimes I want to just see week or month, quarters tend to be pretty worthless. Especially if I’m doing something discrete, I really don’t like the…
-
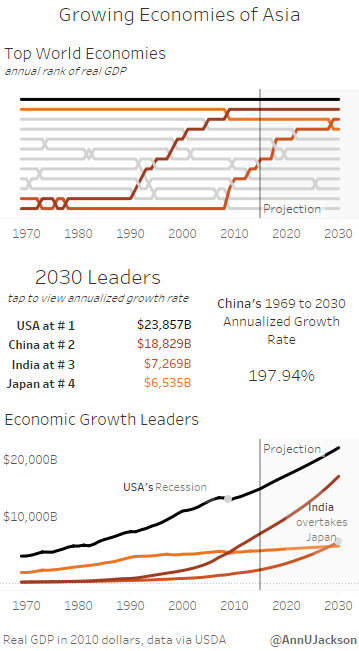
#IronViz Entry – Mobile Design
Part of being involved in the Tableau community means publicly publishing visualizations to learn and grow. It’s also a great way to find inspiration. As I’ve pushed myself to be more active within the local Phoenix Tableau community and social (Twitter) community, I knew it was time to “step up” and make an Iron Viz.…