As a big advocate of #WorkoutWednesday I am excited to see that it is continuing on in 2018. I champion the initiative because it offers people a constructive way to problem solve, learn, and grow using Tableau.
I was listening to this lecture yesterday and there was a great snippet “context is required to spark curiosity.” We see this over and over again in our domain – everyone wants to solve problems, but unless there is a presented problem it can be hard to channel energy and constructively approach something.
Last pre-context paragraph before getting into the weeds of the build. I enjoy the exercise of explaining how something works. It helps cement in my mind concepts and techniques used during the build. Being able to explain the “why” and “how” are crucial.
Let’s get started.
High level problem statement or requirement: build out a dashboard that shows the running total of sales and allows for the user to dynamically change the start of a fiscal year. The date axis should begin at the first month of the fiscal year. Here’s the embedded tweet for the challenge:
#WorkoutWednesday This week we are working with fiscal years and running totals.https://t.co/vrRGclHINO
Shout out to @lukestanke who out together a great site, and will be partnering with me for WoW, so be sure to tag him in your posts. pic.twitter.com/XuhpQyYwIW— Rody Zakovich (@RodyZakovich) January 10, 2018
Okay – so the challenge is set. Now on to the build. I like to tackle as many of the small problems that I know the answer to immediately. Once I get a framework of things to build from I can then work through making adjustments to get to the end goal.
- numeric parameter 1 to 12 for the fiscal year start
- calculation to push a date to the right fiscal year
- dimension for the fiscal year
- transformation of date to the correct year
- running sum of sales
I’ll spare you the parameter build and go directly into the calculations that deal with the fiscal year components.
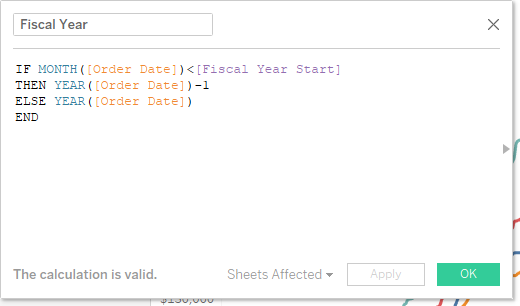
Logic as follows – if the month of the order date is less than the fiscal year start, then subtract one from the year, otherwise it’s the year. I can immediately use this as a dimension on color to break apart the data.
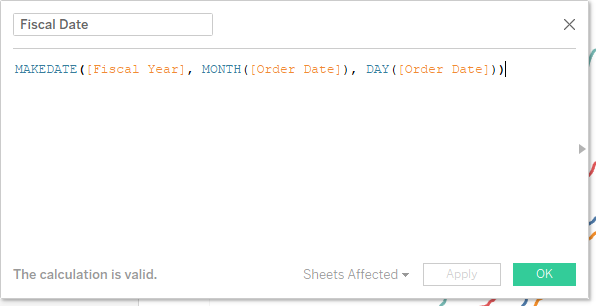
The next step would be to use that newly defined year with other elements of the original date to complete the “fiscal year” transformation. Based on the tooltips – the year for each order date should be the fiscal year.
Now that the foundation is in place, the harder part is building a continuous axis, and particularly a continuous axis of time. Dates span from 2013 to 2017 (depending on how you’ve got your FY set up), so if we plotted all the native dates we’d expect it to go from 2013 to 2017. But that’s not really want we want. We want a timeline that spans a single year (or more appropriately 365 days).
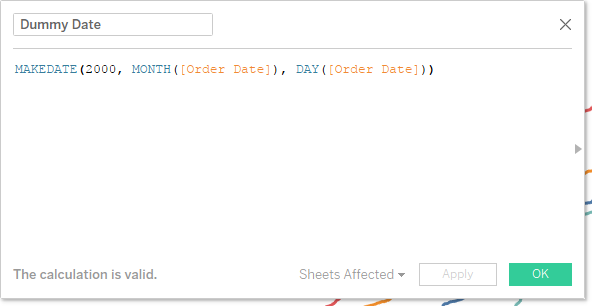
So my first step was to build out a dummy date that had the SAME year for all the dates. The dates are already broken out with the FY, so as long as the year isn’t shown on the continuous axis, it will display correctly. Here’s my first pass at the date calculation:
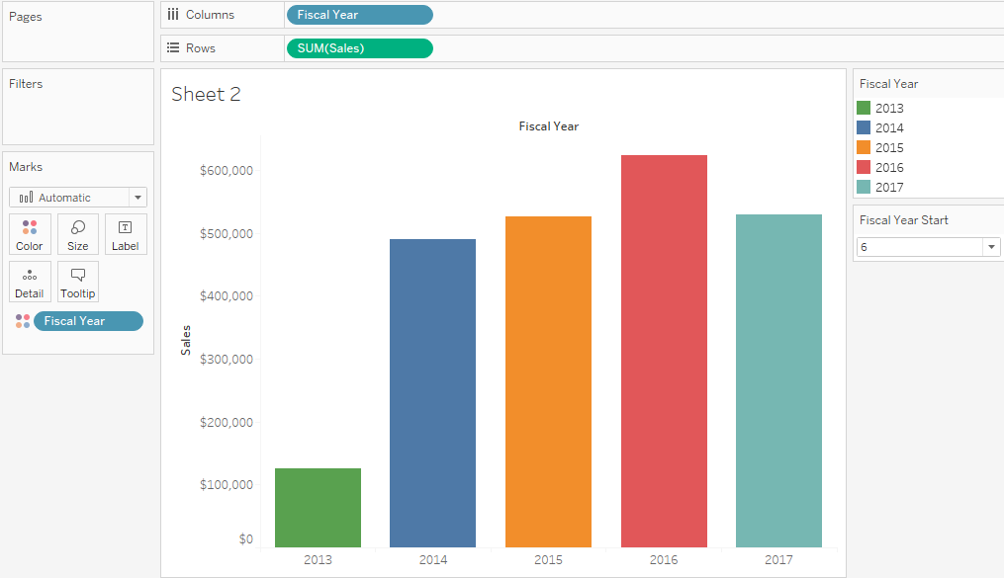
That gets me the ability to produce this chart – which is SO CLOSE!
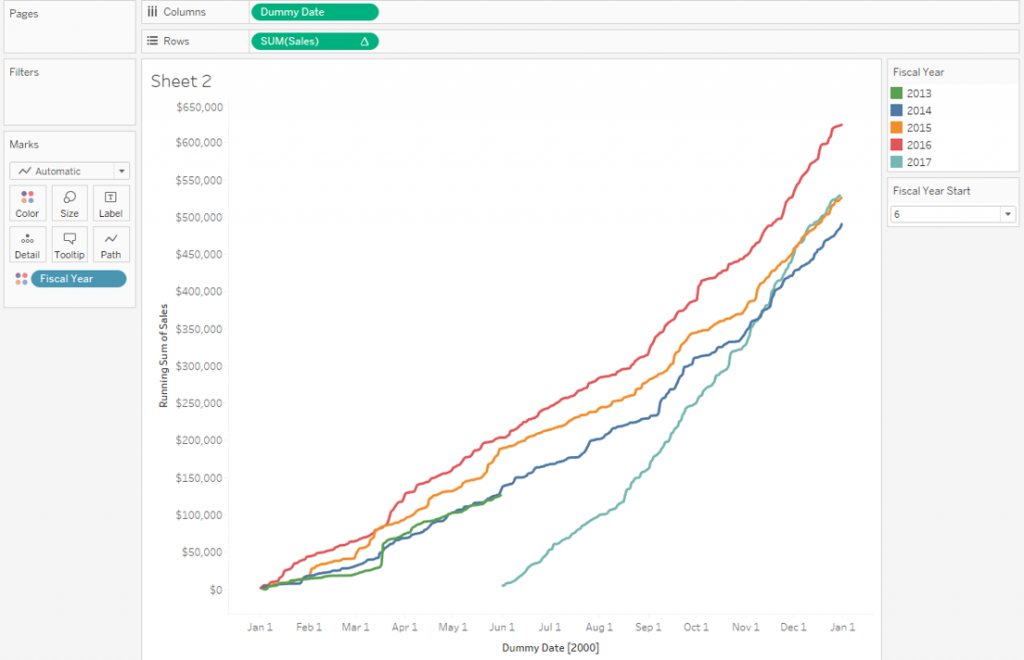
The part that isn’t working is my continuous axis of time is always starting at 1/1. And that makes sense because all the dates are for the same year and there’s always 1/1 data in there. The takeaway: ordering the dates is what I need to figure out.
The workaround? Well the time needs to span more than one year and specifically the start of the axis should be “earlier” in time. To achieve this – instead of hard coding a single year 2000 in my case, I changed the dummy year to be dependent on the parameter. Here’s the result:
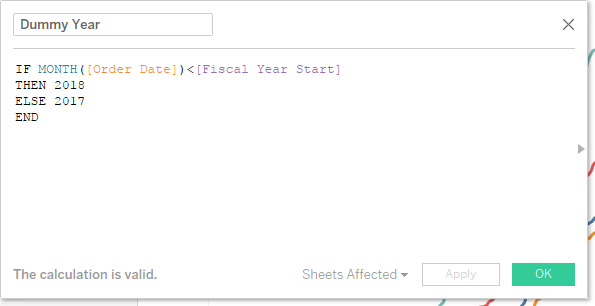
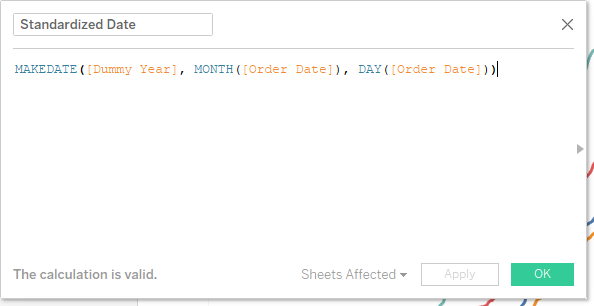
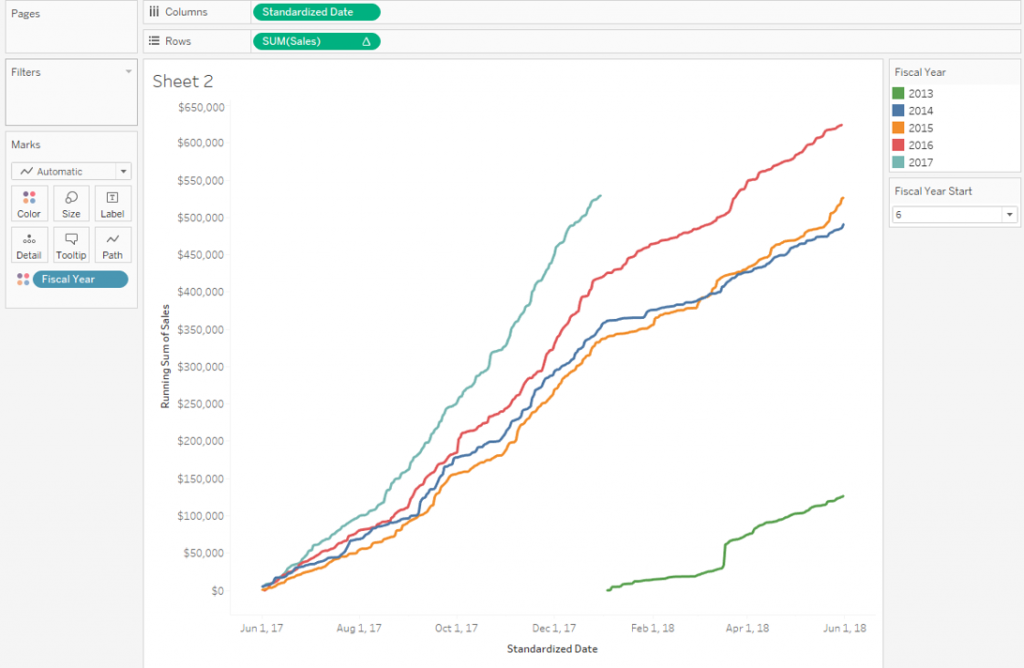
Basically offset everything that’s less than the chosen FY start to the next year (put it at the end). (Remember that we’re already slicing apart the data to the correct FY using the previous calculations.) The combination of these two calculations then changes the chart to this guy which is now mere formatting steps away from completion.
The full workbook is available to download here.
Pingback: W1802 – Tableau More