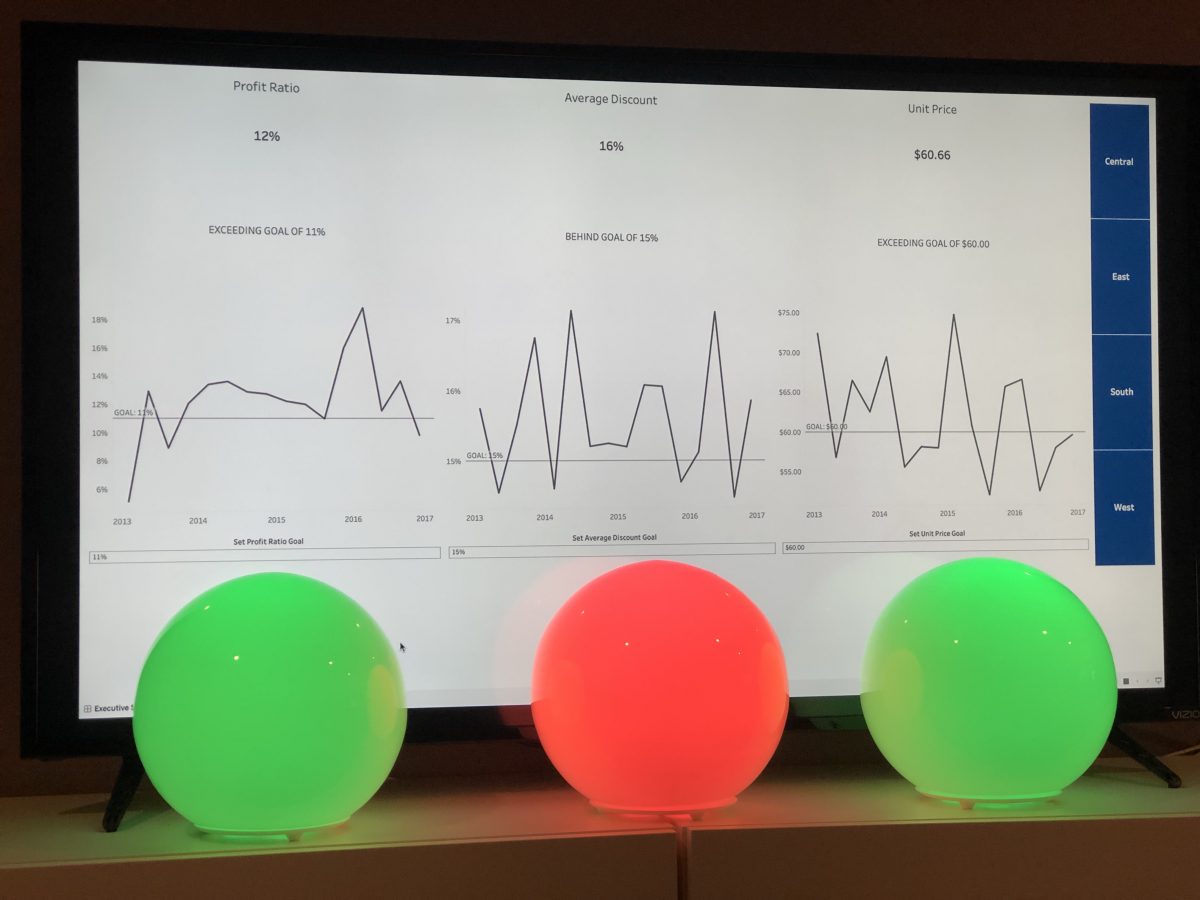
You’ve asked and it’s time to answer. About a week ago I posted a teaser video on Twitter that showed how I integrated my home automation system with a Tableau dashboard. The outcome of the video was dynamically changing three different lights in conjunction with KPI results.
So beyond the “hey this is really cool” factor of connecting lighting fixtures (or anything else for that matter) to a Tableau dashboard – there are some great practical reasons to do this. A few great replies to the tweet were of the same sentiment of the thoughts coursing through my mind. Use something like a light to easily indicate a status – it’s that step back from the KPI shape or the BAN (big ass number). It’s something visible that you can glance at to immediately understand performance.
Next comes the technical components of how this gets put into place. To achieve integration between my home automation system and Tableau I used Python. It serves as a great integrator and took an idea to proof of concept quickly. Python benefits this situation because several people have developed libraries and published them on GitHub to share. And the other reason why Python was a great natural choice is because of TabPy. TabPy allows you to connect to a Python server and run native Python code through calculated fields. These calculated fields are served up on a Tableau sheet as a table calculations. And in general when you’re using Python with Tableau it’s to get a number/string/boolean result out.
So just because you are supposed to use TabPy for something doesn’t mean you can’t extend it’s capabilities and use it in a completely different manner. And that’s exactly what this integration project was about.
This project is also about taking a continuous project I have around home automation and folding in something new I learned (Python) with something I already love (Tableau).
My final caveat is this: if you’re looking to emulate what I did you’re going to need some hardware aka Philips Hue lights and a bridge. In theory you can change this out with the home automation pieces of your choice. If you’re unfamiliar with what home automation is – it basically works by having a controller (often called a bridge) and then different connected elements. The controller is responsible for issuing commands to things like lightbulbs, locks, and your thermostat. It is also the vehicle that takes how you interface with your home automation system (which is typically a mobile app) and translates those commands, routines, or programs to the elements in the system.
And specific to this project, I’m interfacing with my bridge (controller) using a Python library. The library I chose to use was Phue, a Python library designed to fully interact with the Hue API.
First I downloaded and installed Phue into my Tableau-Python-Server environment (aka the one used for TabPy). That allows me to call the library in my Python scripts that are passed through Tableau. During the install process I also ran a simple script to connect the library to my bridge – a necessary dependency to get this all to work. It makes sense that you’d have to be able to establish a link between the communication component and the lights you want to change.
The next parts are all reading through documentation, trial and error with Python, and fun with Tableau. Here’s the final calculated fields that are driving results:

Profit Ratio KPI – this is something we’re all used to. I’ve taken the basic Profit Ratio calculation and had it evaluate against a parameter. Based on the evaluation the result will be either 0 or 25000. The numbers 0 and 25000 correspond to the color hue input required for the lights. 0 is red, 25000 is green.

And here’s the calculated field that is pure Python. In this scenario I’m not actually using Python to crunch anything and return a result, so you’ll notice that the return argument is a dummy number 1.
You will see it in the calculated field description in the editor within Tableau – to use SCRIPT_INT (or any of the SCRIPT functions) the format is: put your code in quotes and any inputs or arguments being used are called using _arg1, _arg2, _argN. Those arguments follow the comma after the script. In my example I have one argument, [Profit Ratio KPI] and that is being assigned to a in the code.
- The basic outline of the code is as follows:
- set [Profit Ratio KPI] to be a
- import phue library so we can use it
- use my bridge (that’s the bridge’s IP address on my internal network)
- set the saturation of the lights to 254 – this is extra code, but ensures that the light has full saturation
- set the light hue to the value of a
- return 1 – just for fun!
If you’re extra interested, the functions from Phue require you to select which light you’re going to be controlling. The Profit Ratio KPI light was number 25.
A trial and error moment here. As I was testing this code I had a Jupyter notebook up and was entering the same code snippets to test it outside of Tableau. Under normal circumstances I was able to assign a number to a without any issue, execute the code, and have the lights change colors. Inside of the Tableau space I had to call the first index “[0]” of the argument. I haven’t looked through the documentation for TabPy in enough detail, but it leads me to believe that arguments come in as lists instead of single variables. So to isolate out the one result I wanted, I had to specify which element I wanted in my list of one variable. So my KPI result is really like [25000] in Python notation and has to be called as _arg1[0] (non-Python folk: Python indexes start at 0).
Literally everything else about this was setup and build of the Tableau components. Building out the BANs and adding parameters to dynamically input the goal variables. Everything else was connected and working after the correct code was entered.
Here’s what one of the BAN sheets looks like:

The calculated field is present on detail, but not used anywhere else in the view. (Which if you hovered over a default tooltip would show “1”).
Once the visualizations are set it’s just a matter of interacting with the dashboard to start seeing this integration take effect. You’ll notice during the video that it’s not super fast – there is definitely an element of time. And that makes sense – there is a bunch of overhead to take an argument from Tableau that has to be computed, push it through a Python server, and wait for a result to return.
This is a beautifully simple integration and demonstration of how to take the mantra of seeing and understanding data to the physical world. With a few lines of code data-driven performance can exist in the physical world.
Leave a Reply