Tag: internet usage
-
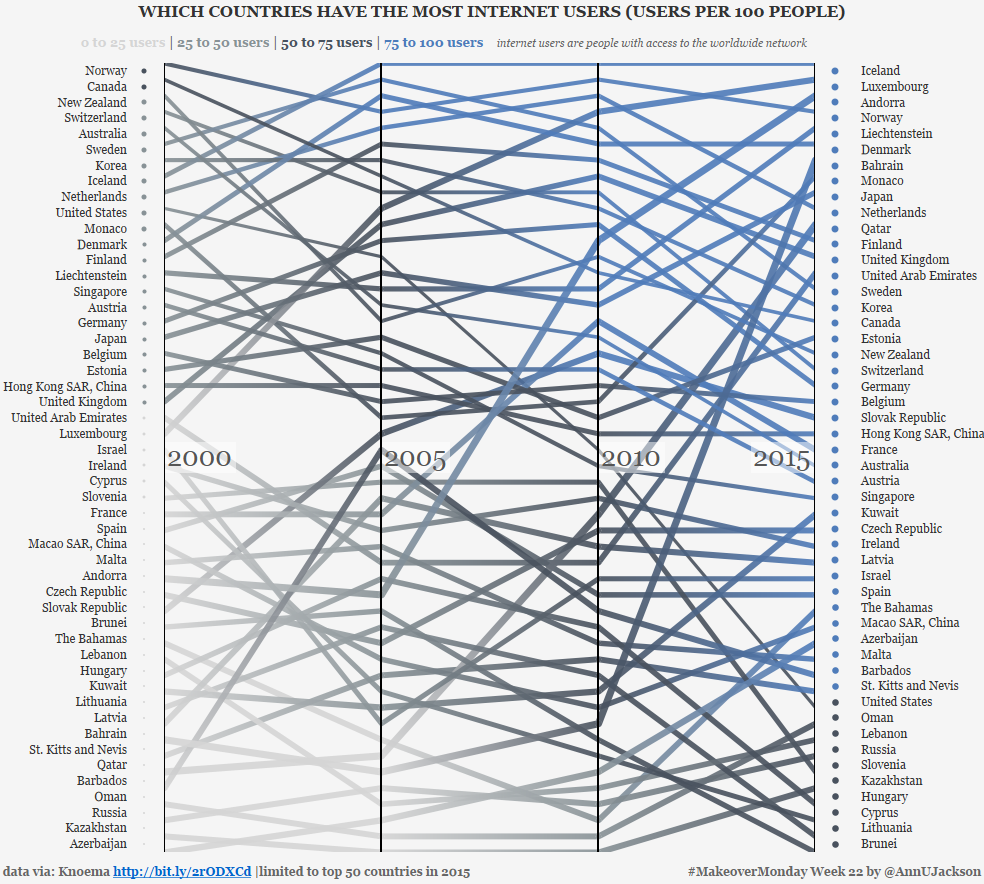
#MakeoverMonday Week 22 – Internet Usage by Country
This week’s data set demonstrates the number of users per 100 people by country spanning several years. The original data set and accompanying visualization starts as an interactive map with the ability to animate through the changing values year by year. Additionally, the interactor can click into a country to see percentage changes or the…