This month I’ve been taking a night class at Galvanize aimed at being an introductory to Python and Data Science. It’s a 4 night/week boot camp with a mix of lecture and hands-on assignments. My primary interest with the course was the data science component, but I also felt extremely strong about the necessity to have a programming language in my toolkit.
To add context – I’ve taken formal classes in C++ and Java, know enough HTML/Javascript to be dangerous, and can leverage SQL when forced. I’ve always had very positive retrospective moments about learning C++ and particularly think the act of writing pseudo-code has been a skill I’m lucky to have.
When learning anything new I think it’s required to put it in action. So I have some small immediate goals related to Python that focus on integration or utility to Tableau. In fact earlier this year I dabbled in the topic and spun up a Linux box to go through the published exercise of using Python+NLP. Specific to that exercise I actually did the NLP processing within Python and exported the results.
This leads me to Wednesday, where I was presented with a new opportunity to combine skill sets. The premise was pretty straightforward – take concepts of Monte Carlo scenarios/simulations/method for corporate finance and use it to develop visualizations. The key to this is that a historic input or perhaps expected input (likely derived through some analysis) and it’s corresponding standard deviation are used along with the probability component of random numbers bounded to a normal distribution. A fancy way of saying (at least for this example) – generate numbers based on X, it’s standard deviation, and random numbers. Specifically of the format Result = X + (SD*RandomNumber). And several results are computed. It’s like rolling dice over and over again and seeing what happens.
So this initially was conceived and in working order in Excel – and the kicker of why it works in Excel is a function that does that tidbit I mentioned above “random numbers bounded to a normal distribution.” The functions used to generate that aren’t available in Tableau. And this is where Python came to the rescue.
Because Python has depth in mathematical libraries it seemed like a natural choice to outsource the computation of these random numbers to it.
To get started I read through this community article: Tableau Integration with Python – Step by Step. It provides the pertinent components of how to get Tableau and Python to talk – most specifically how to use the SCRIPT_() functions in Tableau to pass through Python code to TabPy.
Once that was done I needed to develop a data set to use under the hood of the workbook (remember pretty much everything is parameterized – so there’s no data to read in). I ended up making an Excel spreadsheet with 1,000 rows – each with a row number (1 to 1,000).
The simulation results are this calculation:
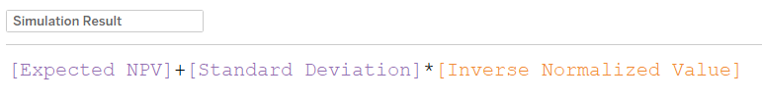
So you can see – 2 parameters (purple) and then one calculated field. The calculated field is where Python jumps on the scene.
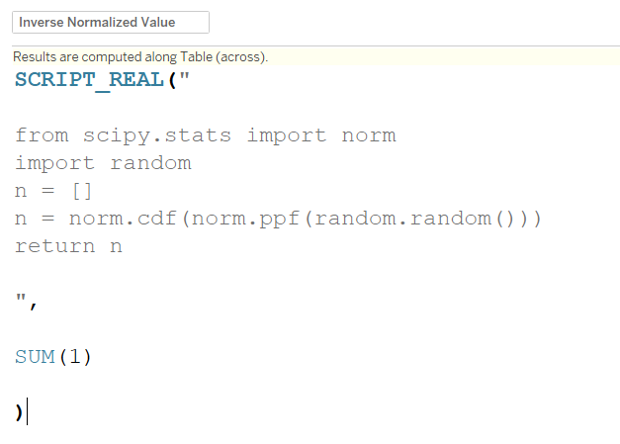
Breaking this down a bit further:
- SCRIPT_REAL() – takes in blocks of code within quotation marks followed by arguments (that must be aggregated). It outputs a real number (opposed to integer, string, or boolean)
- Python script is pretty basic: import 2 different libraries
- norm from scipy.stats – this gives me the function norm.ppf() that allows the conversion of a random number to be in that normal distribution format
- random.random() – just a random number function
- Named n as a list and set it equal to the output of my functions
- returned the value n
I noticed when I did this I had to supply an argument (essentially a comma with SOMETHING after it to avoid errors in my calculated field). So I added on a simple SUM(1). This calculation is being called at a row level, so it’s just 1 and not used anywhere. If I were going to use it, I’d need to include _arg1 (or _arg2, _argN) and follow up with those input arguments separated by commas.
SCRIPT() calculations always come on as Table Calculations – so you’ll see the icon and have all the nuance of Table Calculations. Namely that they’re computed in the view and you can’t make something like bins with them or use them for sorting.
Here’s the final dashboard (in it’s initial state):
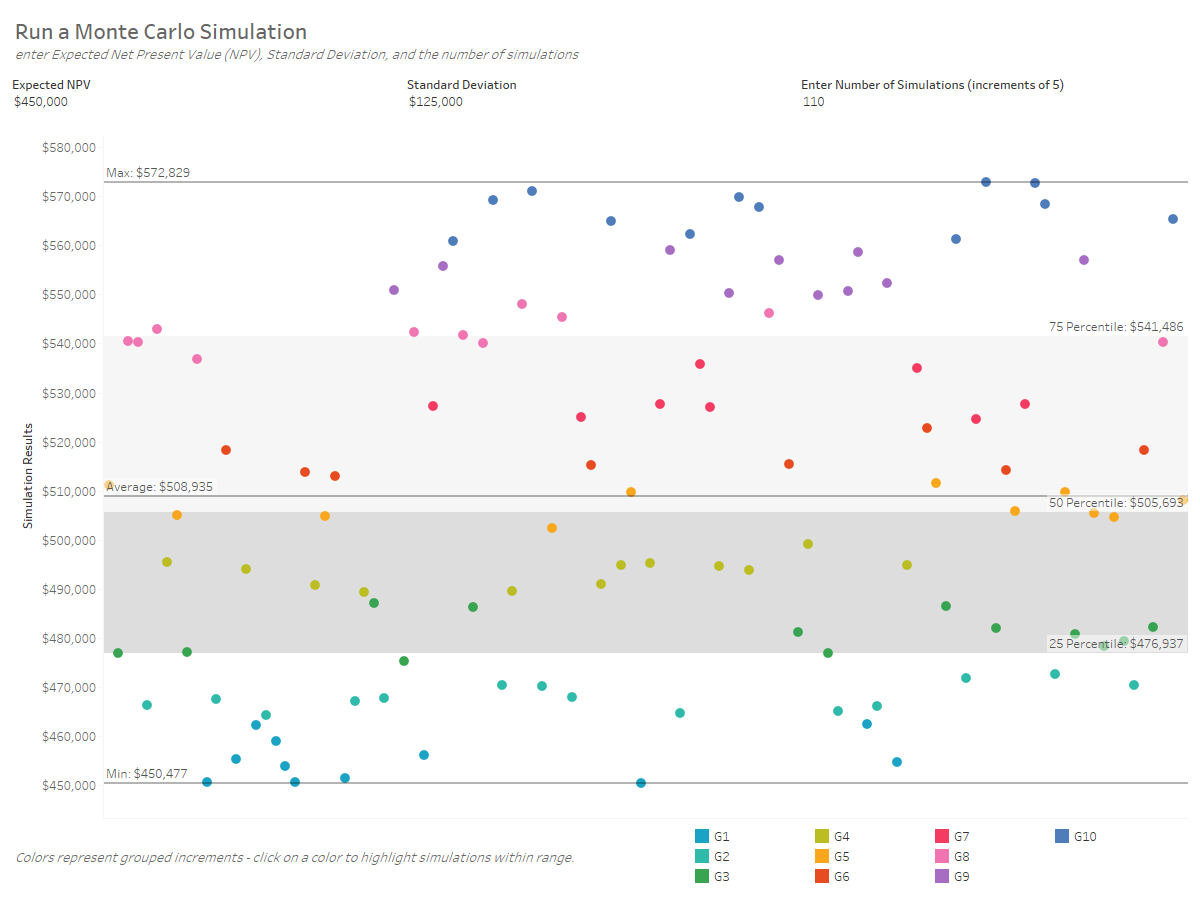
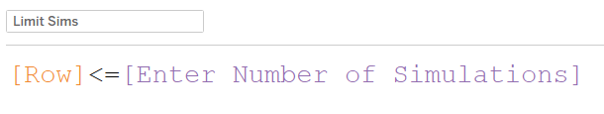
You’ll see the different inputs and the ability to set the number of simulations. This is simply a parameter that limits the row number of the underlying data.
As I was playing around this – one of the keys to this analysis is to show the spread of the different results (ideally maybe a histogram). So I stuck with confetti for now, but added on reference bands and lines. Additionally I colored the simulation results using a custom binning technique where I find the range between Min & Max, divide that by 10 and then create bins with the Min+ multiple of range/10. Here’s the calculated fields:
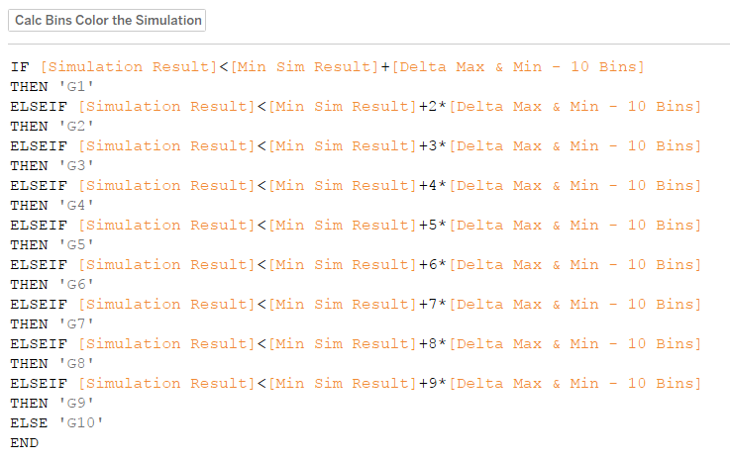
This allows the end user to click on the color legend to see the number of simulations within each “bin.” And to see through random chance how the simulations really distributed.
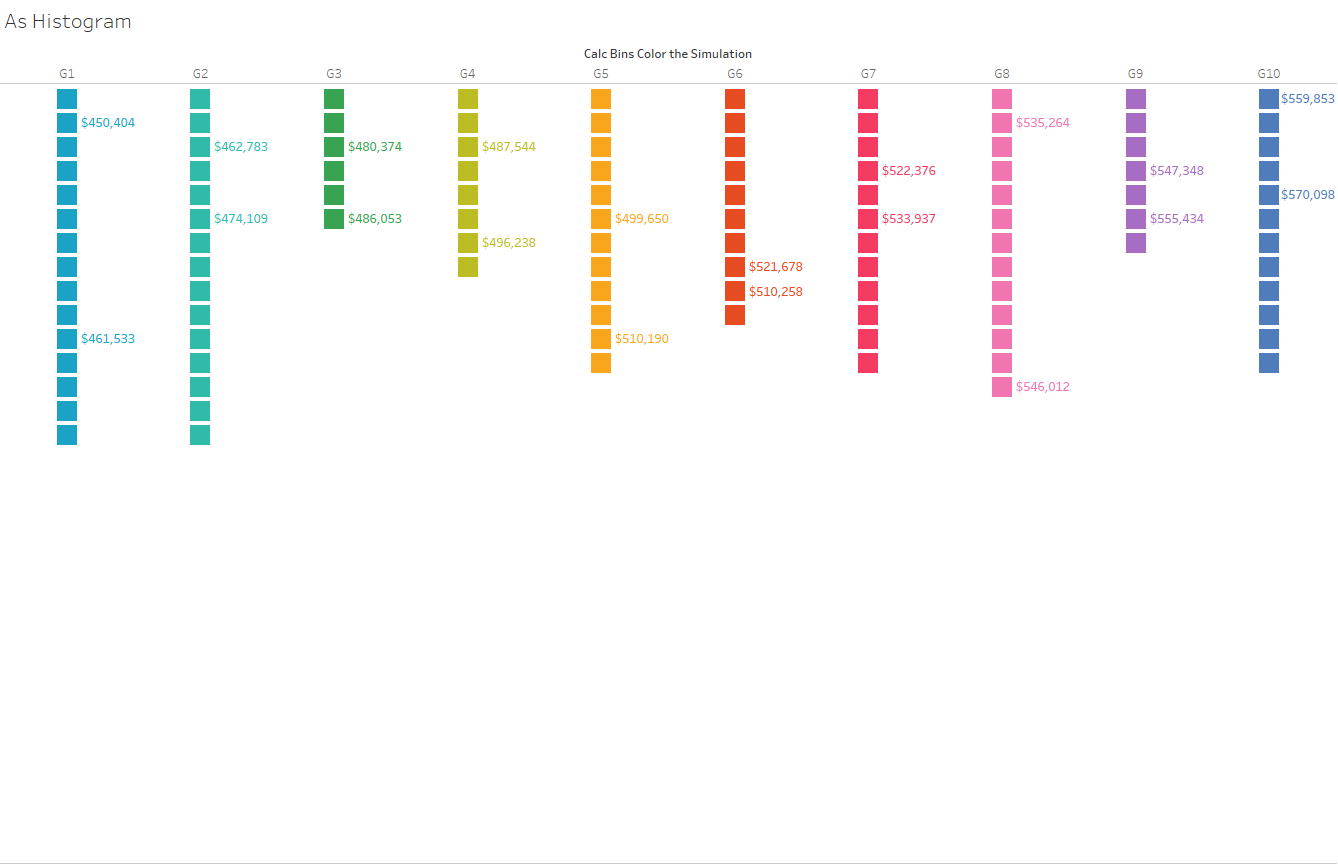
I also made this sheet, which has some advantages of expressing that concept a bit more clearly. Through 110 simulations – here’s where the results fell out.
In terms of the visual outputs – I’d still say I’m at an exploration stage of finding what works best. However, from a Python/TabPy angle – I was pretty enthused to put it all in action. And most specifically one thing I appreciate about this is that when the simulation number is changed, it’s the act of running a “new simulation.” Same with all of the parameters – but something very satisfying about the act of data changing on the fly.
Next week we’re finally tackling NumPy and Pandas – so I expect some inspiration to come.