It’s time for week two of the data postcard project Sarah Bartlett and I are working on this year. During this week our focus was spent on transportation, essentially how we get to different places.
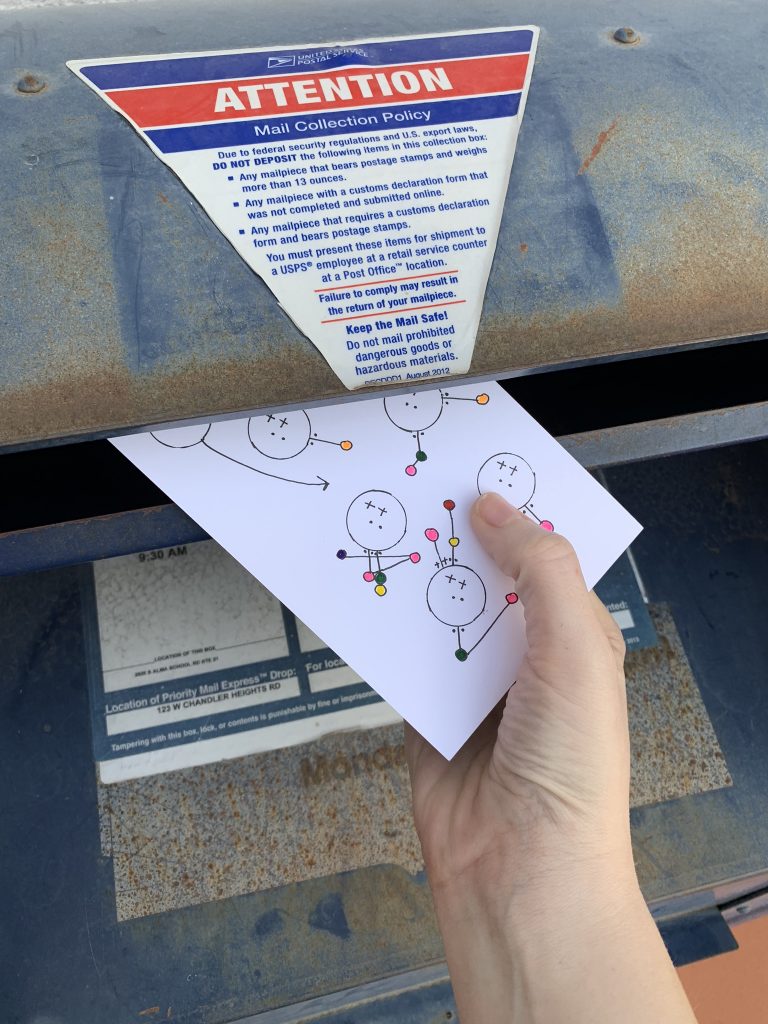
I live in the suburbs of Phoenix, AZ, tend to work from home, and drive to most places (read that as everywhere). So for this week, I decided to spend some additional time plotting my routes and tallying who was with me. Here’s my postcard:
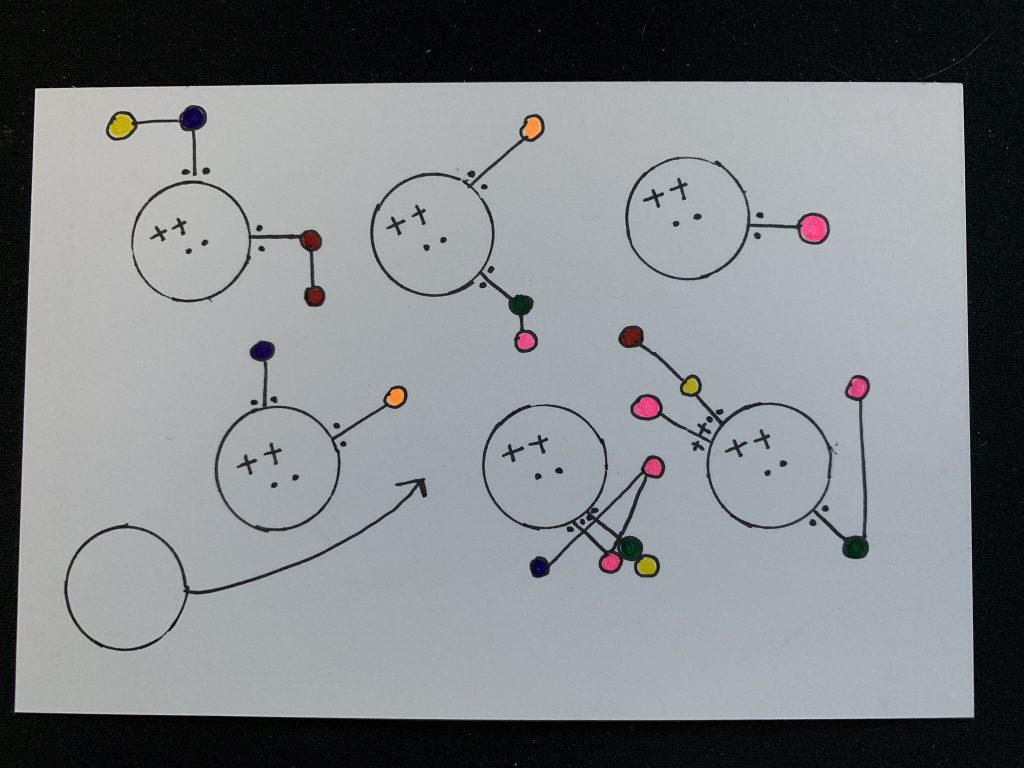
Each circle represents a day of the week (starting with Sunday) and my house. The lines going from the circle are paths that I took, each one representing a trip in the car. The direction from the circle is equivalent to the cardinal direction and each of the destinations are categorized into different colors. I also included who was with me and who was driving.
I feel like this week’s postcard is very revealing in terms of my personal life. You can immediately tell that (at least for this week of tracking) I go nearly everywhere with my husband and that he is the primary driver. You can also see that I like to efficiently plot most of my paths and I also try to go to more than one place per trip. There are some fun exceptions to be seen, particularly on Friday, where I went to 2 different grocery stores in search of a very specific item (and still didn’t find!). The other exception was on Saturday, where I ended up driving. This was due to a spur of the moment trip after a few beers (not by me!).
I also didn’t drive anywhere on Thursday and had planned to draw it on the postcard as a null in line with the other days. Magically I forgot to include it and had to re-add it. I actually quite like the authenticity and whimsy of that part, I think it reinforces the idea that this was something hand-drawn vs. computer generated.
By contrast, here’s Sarah’s week 2 postcard:
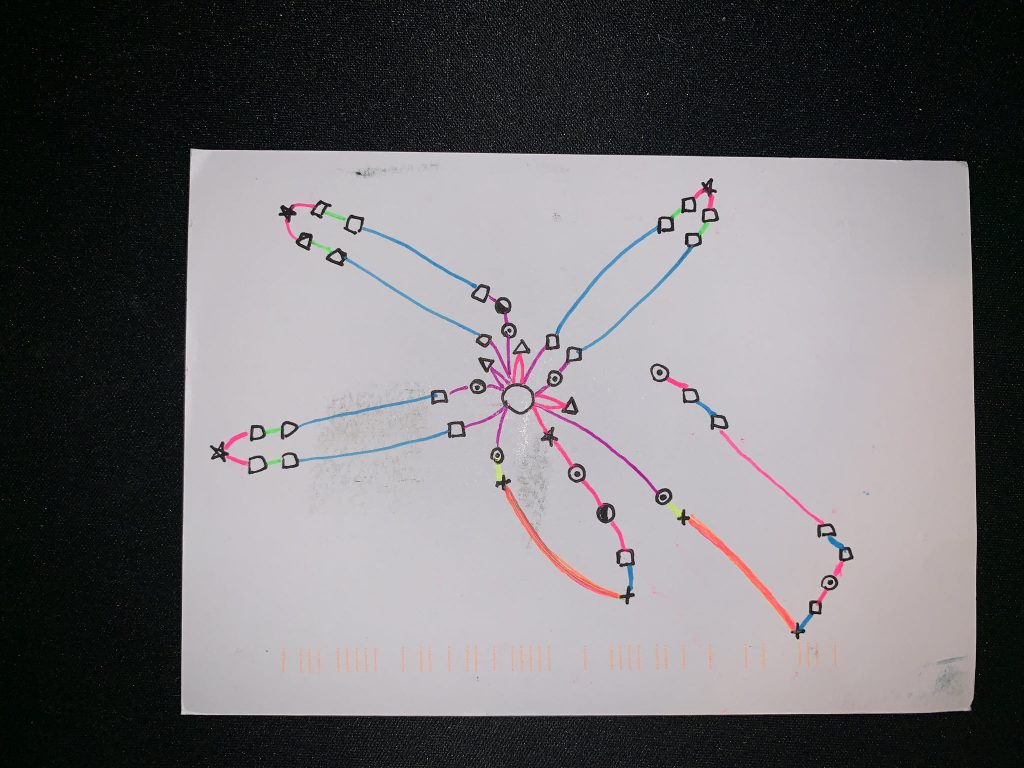
Sarah chose to take a different path that I believe turned out really well – she created (what to me) looks like a flower that displays where she went and how she got there. In stark contrast to me, it seems like Sarah is rarely in a car and spends most of her time in other modes of transportation. I also really like the symmetry of the blue petal days, where she heads to the station, gets on a train, then the tube, goes to the office, and comes back. I am guessing when there’s nothing atypical in her week that most days look like that.
I really enjoyed tracking this week and taking a different approach to sketching (and actually being OK with an oops moment). I’ve also been having an on-again off-again conversation with my husband on whether we should go back down to one car and after seeing the data I am more convinced than ever that we should downsize and switch to electric (although it can’t be seen, every destination was within a 10 mile radius of my home).
Don’t forget: check out Sarah’s blog post and get her take on the week.