Makeover Monday 2017 – Week 2
It’s time for Makeover Monday – Week 2. This week’s data set was the quarterly sales (by units) of Apple iPhones for the past 10ish years. The original article accompanying …
Data Visualization & Analytics Consulting

It’s time for Makeover Monday – Week 2. This week’s data set was the quarterly sales (by units) of Apple iPhones for the past 10ish years. The original article accompanying …
Another great community activity is Workout Wednesday hosted by Andy Kriebel and Emma Whyte. According to Andy it’s “designed to test your knoweldge of Tableau and help you kick on …
It’s officially 2017 – the start of a new year. As such, this is a great time for anyone in the Tableau universe to make a fresh commitment to participate …
I typically spend the end of my year self reflecting on how things have gone – both the good and the bad. Usually that leads me to this thoughtful place …
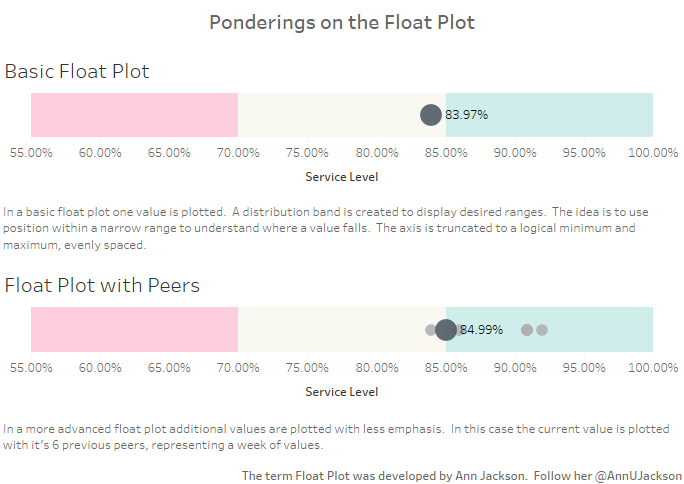
One of the more interesting aspects of data visualization is how new visualization methods are created. There are several substantial charts, graphs, and plots out there that visualization artists typically …
I’ve had this idea for a while now – create a blog post and video tutorial discussing what Statistical Process Control is and how to use different Control Chart “tests” …
And it’s time – my first ever Makeover Monday. I’ll admit, I’ve attempted to catch up in the past, but always lost steam. I think the first data set might …
Last night was our monthly Phoenix Tableau User Group (PHXTUG) meeting and as part of the post-excitement of Tableau’s 2016 conference we took some time to go through their strategy …
Admittedly I’m jumping from day 1 to day 3. I hit a micro wall on Tuesday. But now that I’ve pushed through to Wednesday – it is time to focus …
What better way to commemorate my first day at #data16 than sharing the highs, lows – what has met expectations and what I didn’t expect. The community – Probably the …