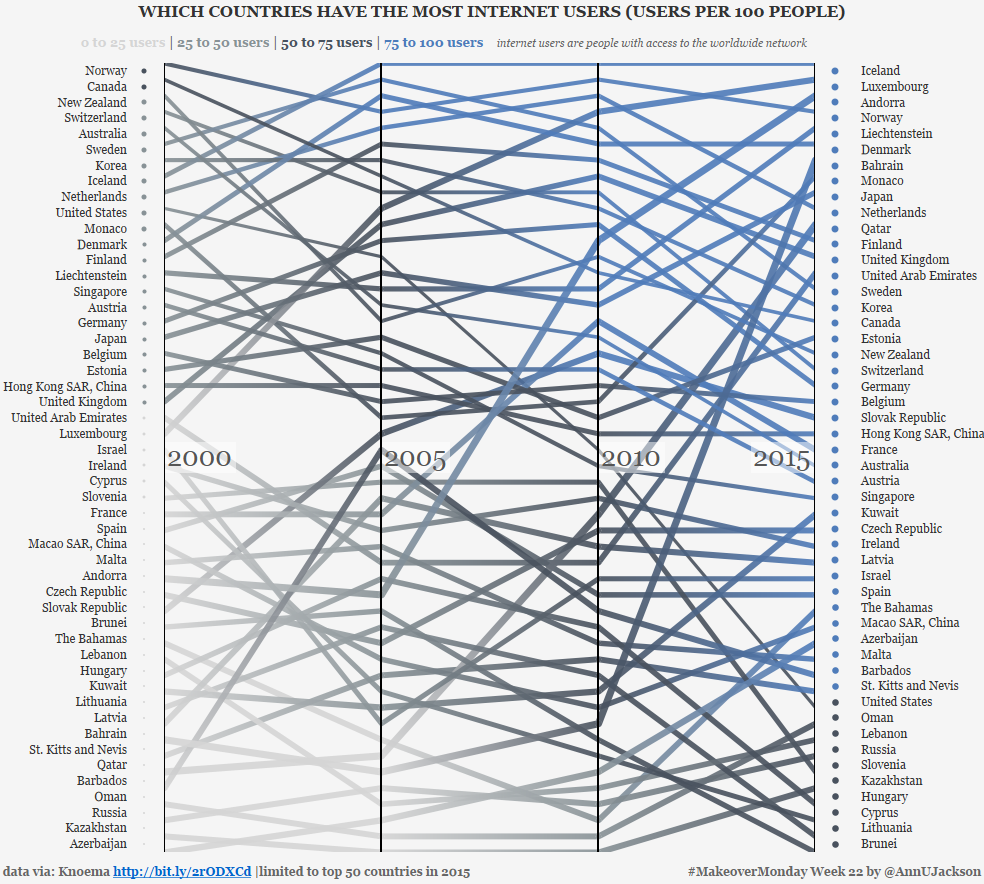
#MakeoverMonday Week 22 – Internet Usage by Country
This week’s data set demonstrates the number of users per 100 people by country spanning several years. The original data set and accompanying visualization starts as an interactive map with …
Data Visualization & Analytics Consulting
This week’s data set demonstrates the number of users per 100 people by country spanning several years. The original data set and accompanying visualization starts as an interactive map with …
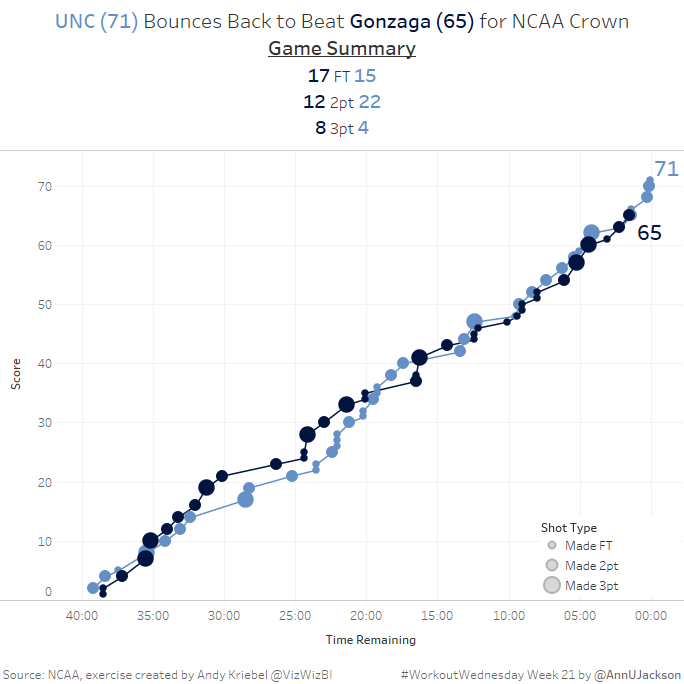
This week’s Workout Wednesday had us taking NCAA data and developing a single chart that showed the cumulative progression of a basketball game. More specifically a line chart where the …

After some botched attempts at reestablishing routine, #MakeoverMonday week 21 got made within the time-boxed week! I have one pending makeover and an in-progress blog post to talk about Viz …
I’ve been very interested in pursuing a concept I originally saw in my twitter feed, a picture of Chris Love at a pub with a blurb about ‘Viz Club.’ Following …

Recently I was on a project that involved working with data centered around one value. You can imagine the type: something where there is an intended value, or a maximum …

Time for another recount of the content I’ve been consuming. I missed my March post, so I figured it would be fine to do a combined effort. First up: The …
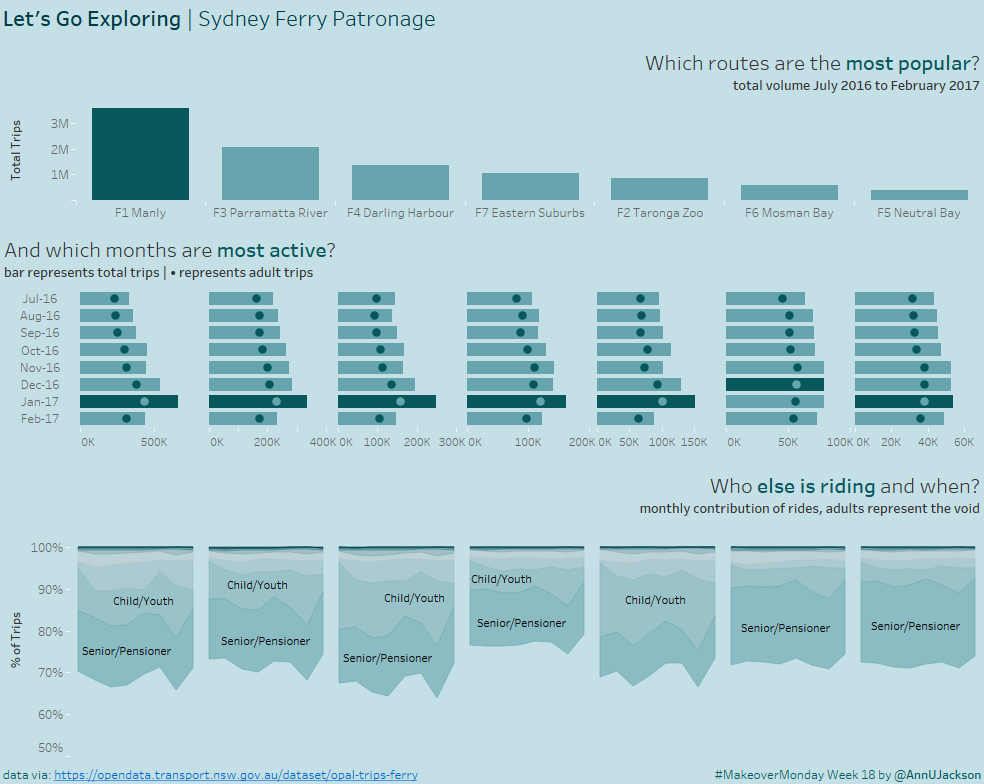
{witty intro} This week’s makeover challenge was to take Sydney ferry data for 7 ferry lines and 8 months. What’s even better is there was another dimension with a domain …